Competitor Analysis and Competitive Advantage Double Bar Chart
RJ0600060_10
- Last Update 07/06/2025
- File Size 1MB
- # of Slides 2
- File Format PPTX
- Slide Ratio 16:9
- Color
Keywords
- #Content-Based Slides
- #Design-Based Slides
- #Market and Competitor Analysis
- #Graph
- #Competitor Analysis
- #Competitive Advantage
- #Horizontal Bar
- #Double Horizontal Bar
- #16:9
- #double bar chart PowerPoint
- #competitor analysis presentation
- #comparison graph slide
- #market analysis chart
- #data visualization PPT
- #horizontal bar chart template
About the Product
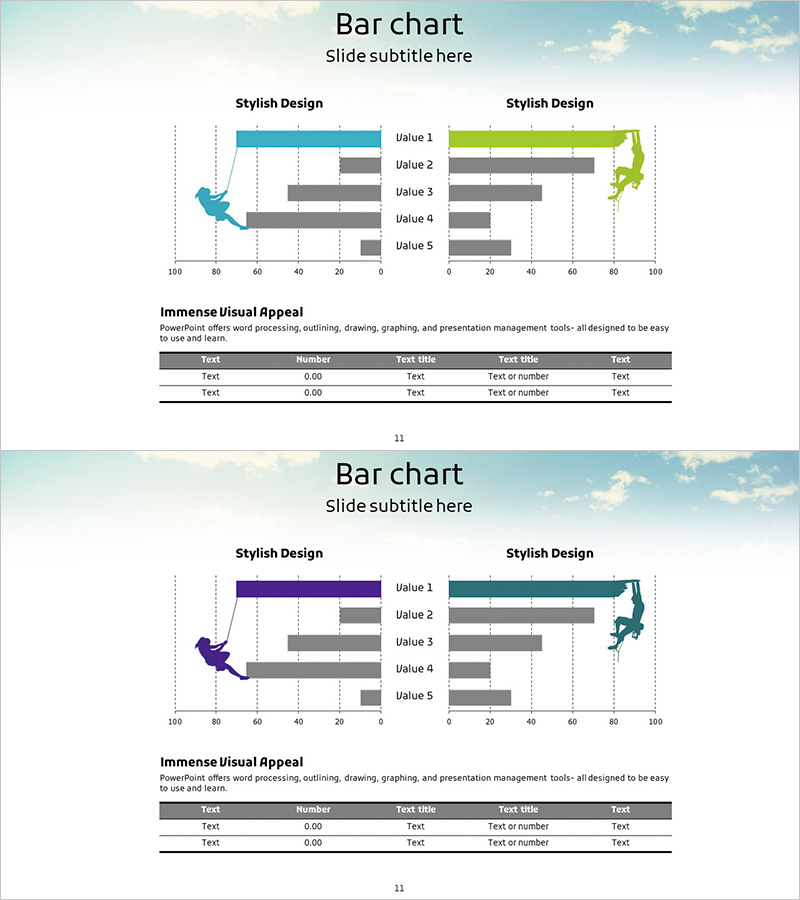
A double bar chart PowerPoint slide designed for competitor analysis and competitive advantage visualization. This presentation template displays five data items side-by-side with contrasting left and right bars, making competitive positioning immediately clear. Regional map icons (Turkey and Japan) enable geographic market analysis, while the light sky-blue background and teal-gray color palette create a professional appearance. The 2-slide set allows flexible representation of multiple datasets, with fully editable text and numerical values for immediate presentation use.
Usage Points
-
Main Usage
Data visualization for competitor analysis and competitive advantage comparison. The dual-bar layout presents five metrics from two perspectives (company vs. competitors, or two competitors), allowing bar length and color to highlight relative strengths and weaknesses intuitively.
-
How to Use
Use in market analysis presentations, executive reports, and strategy planning meetings to explain competitive positioning. Bar lengths and colors emphasize numerical differences, while map icons add geographic market context.
-
Recommended For
Marketing team market analysis presentations, executive-level competitive strategy reports, business plan market overview sections, and investor pitch deck competitive advantage explanations.
-
Slide Structure
2-slide set. Each slide contains a title area, left double bar chart (5 items, teal color), right double bar chart (5 items, gray color), regional icons (Turkey and Japan), legend, and data table section for easy customization.
Related Products
-

Competitive Comparison Analysis Bar Graph – Visualizing Market Advantage
#Market and Competitor Analysis #Graph #Competitor Analysis
-

Benchmarking with Bar Chart Comparison
#Market and Competitor Analysis #Diagram #Graph
-

Horizontal Bar Graph for Cooking Competition
#Market and Competitor Analysis #Graph #Competitor Analysis
-

Bar Graph Comparing Exercise Performance by Group
#Market and Competitor Analysis #Graph #Competitor Analysis
