Donut Chart of 3 Items – Visualizing Data at a Glance
RB0800020_6
- Last Update 03/21/2025
- File Size 1.3MB
- # of Slides 2
- File Format PPTX
- Slide Ratio 4:3
- Color
Keywords
About the Product
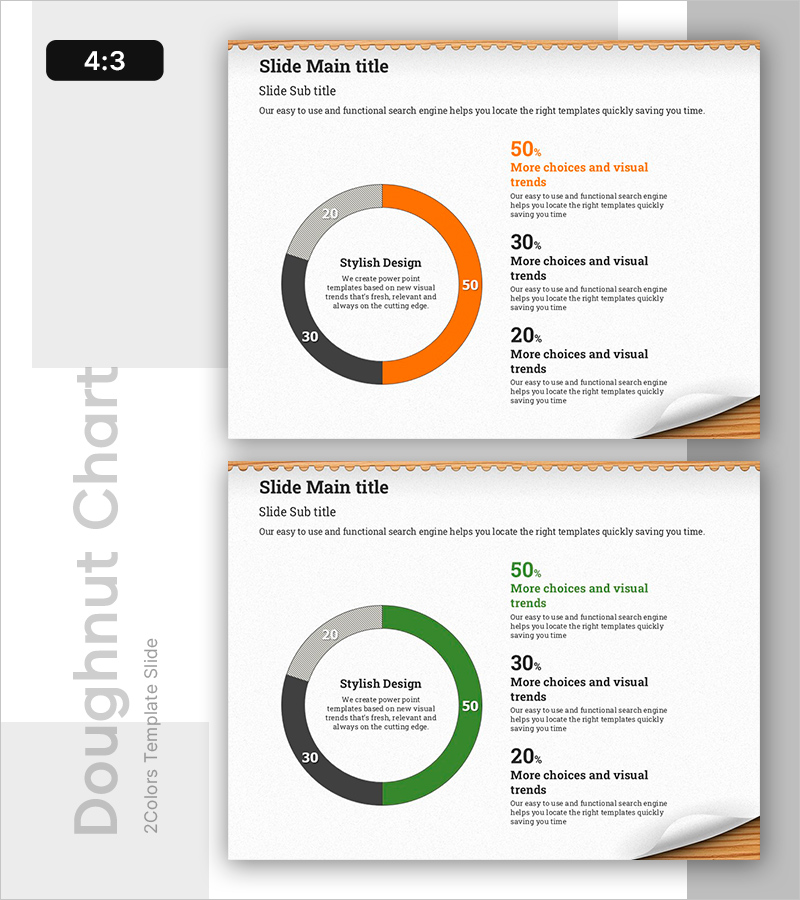
A donut chart PowerPoint slide that visualizes the ratio of three items at a glance. This presentation template features a central message area surrounded by percentage data, making it ideal for data visualization in business presentations. The slide comes in two color themes—orange, gray, and black, or green, gray, and black—allowing you to maintain consistency across your deck while adding visual variety. With 2 slides included, you can quickly adapt this template for business analysis reports, marketing performance reviews, financial composition explanations, and other data-driven presentations. Simply edit the numbers and labels to match your data and insert into your slides.
Usage Points
-
Main Usage
Clearly visualize the proportional relationship of three items so audiences intuitively understand data composition. The central message combined with percentage labels for each segment maximizes information delivery efficiency and audience comprehension.
-
How to Use
Use in business reports, marketing performance analysis, financial composition presentations, market share comparisons, and other data-driven talks. Edit the numbers and labels with your own data for immediate use, and adjust the color theme to match your corporate brand identity.
-
Recommended For
Recommended for finance teams explaining budget allocation, marketing teams analyzing channel performance, executives reporting business composition, consultants preparing client analysis materials, and any role requiring data-based decision-making presentations.
-
Slide Structure
Two-slide set with a central text area ('Stylish Design') surrounded by a donut chart divided into three segments. Each segment displays percentage values (50%, 30%, 20%) in orange, gray, and black (slide 1) or green, gray, and black (slide 2), with descriptive text positioned on the right side of each slide.
Related Products
-

Market Analysis Positioning Map – Market Power and Competitive Analysis
#Market and Competitor Analysis #Marketing Plan and Strategy #Diagram
-

Premium Management Presentation Horizontal Bar Graph
#Business Strategy #Graph #Achievements
-

User Analysis Graph by Age Group – Advanced Data Insights
#Market and Competitor Analysis #Diagram #Graph
-

Origami Line Chart Slide - Visualizing Business Performance
#Business Strategy #Market and Competitor Analysis #Graph
