Asian Target Market Analysis Graph
RJ0900012_13
- Last Update 08/19/2025
- File Size 0.6MB
- # of Slides 2
- File Format PPTX
- Slide Ratio 16:9
- Color
Keywords
- #Content-Based Slides
- #Design-Based Slides
- #Market and Competitor Analysis
- #Graph
- #Other
- #Market Analysis
- #Target Market
- #Column
- #Grouped Column
- #Map
- #16:9
- #world map PowerPoint slide
- #Asia market analysis presentation
- #horizontal bar chart slide
- #geographic data visualization
- #market analysis slides
- #global business presentation template
About the Product
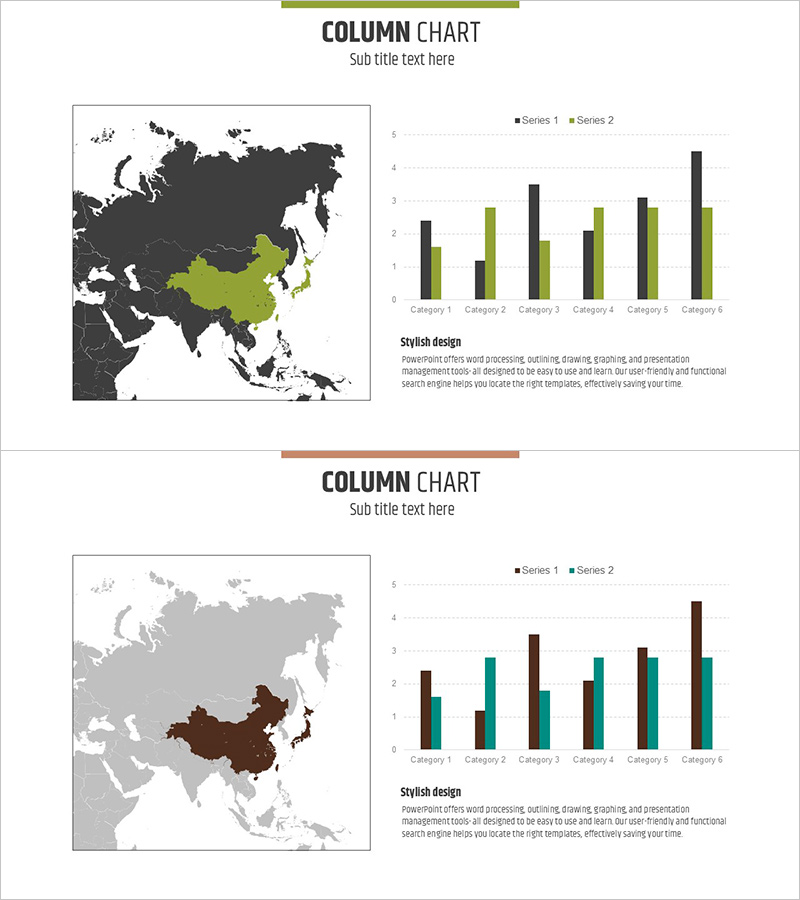
A PowerPoint presentation slide set for analyzing target markets in Asia. Features a world map with Asia region highlighted, combined with a horizontal bar chart comparing 6 categories across 2 data series. The design uses a dark gray background with lime green and charcoal bar colors to convey market data intuitively. Delivered as a 16:9 widescreen format with 2 fully editable slides in PowerPoint format, ready for immediate use in business presentations.
Usage Points
-
Main Usage
Simultaneously display Asia market size, growth rates, and competitive share using both map and chart visualizations for comprehensive regional market overview. Provides credible data representation for international business strategy development and market assessment.
-
How to Use
Use the first slide to highlight Asia on the world map for geographic context. Input actual market data into the horizontal bar chart on the second slide. Modify legend labels and axis titles to match your presentation narrative and data categories.
-
Recommended For
Marketing managers, business development professionals, executive reports, investor presentations, international expansion strategies, market research reports, and global sales team presentations.
-
Slide Structure
Slide 1: World map with dark gray background and Asia region highlighted in lime green / Slide 2: 6-category × 2-series horizontal bar chart with lime green and charcoal bars, including legend. All shapes and text fully editable.
Related Products
-

Target Market Year-to-Year Comparison Analysis – Visualizing Market Trends
#Market and Competitor Analysis #Graph #Other
-

Botanic Garden Wide PPT Map – A Visual Tool for Effective Market Analysis
#Market and Competitor Analysis #Diagram #Other
-

World Map Data Slide | Regional Statistics Visualization PPT
#Market and Competitor Analysis #Marketing Plan and Strategy #Other
-

Leather Material Presentation Template Column Chart
#Market and Competitor Analysis #Graph #Other
