Blue Green Donut Pie Chart – Ideal for Market Analysis
RJ0700009_6
- Last Update 07/24/2025
- File Size 1.5MB
- # of Slides 2
- File Format PPTX
- Slide Ratio 16:9
- Color
Keywords
About the Product
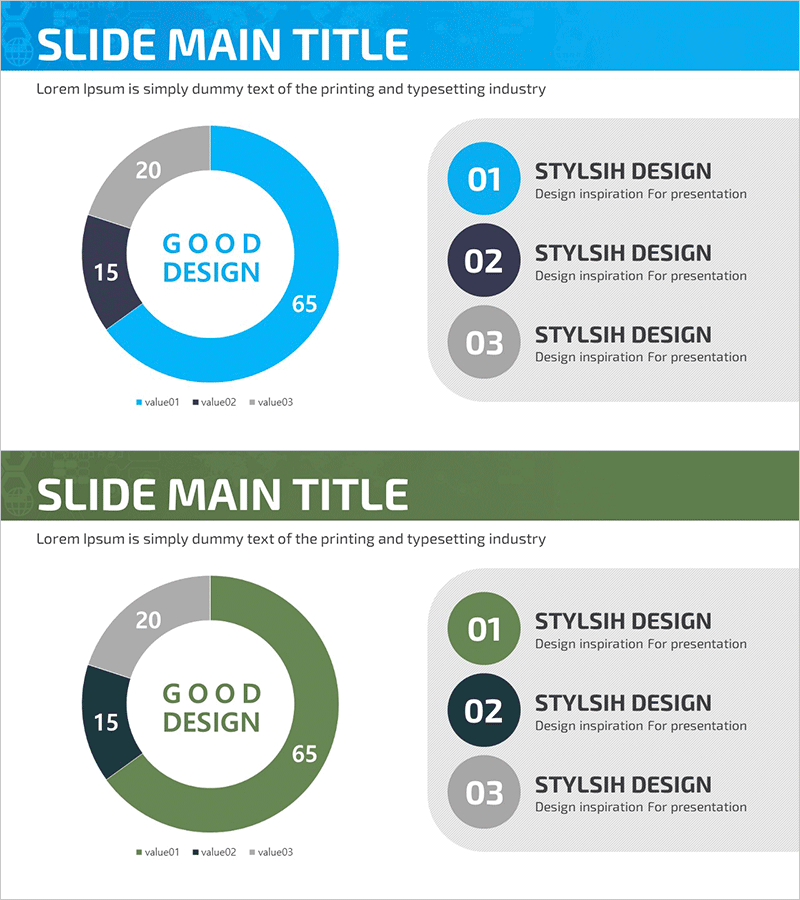
A professional donut pie chart PowerPoint slide optimized for market analysis and statistical data representation. The donut chart features three color segments in blue and green tones, making it ideal for comparing proportions and analyzing component composition. The 2-slide set includes identical layouts with donut-shaped charts, allowing you to visualize three data items with numerical values on each slide. The right side contains numbered text boxes for adding detailed descriptions to each segment, enhancing audience comprehension during presentations. Provided in PPTX format for immediate editing and customization.
Usage Points
-
Main Usage
Effectively displays market share, sales ratios, customer demographics, budget allocation, and other part-to-whole relationships. The center space of the donut chart can accommodate key metrics or titles, enabling instant data comprehension.
-
How to Use
Use in business presentations, marketing reports, financial analysis documents, and market research presentations to visualize quantitative data. Simply replace the slide values and text with your own data to create a professional chart presentation.
-
Recommended For
Marketing professionals, financial analysts, executives, consultants, and educators requiring data-driven presentations. Particularly suitable for market analysis, business performance reports, and investor pitch decks.
-
Slide Structure
Consists of 2 slides, each featuring a 3-segment donut pie chart on the left (blue 65%, green 20%, navy 15%) with three numbered text boxes (01-03) on the right for descriptions. Title area at top and legend at bottom.
Related Products
-

Visualizing Competitive Analysis with Table and 3 Donut Graphs
#Market and Competitor Analysis #Diagram #Graph
-

Shareholder Status Analysis Chart & Description – Sleek Diagram
#Company Introduction #Market and Competitor Analysis #Diagram
-

Status Analysis Donut Chart – Shareholder Status Analysis
#Company Introduction #Market and Competitor Analysis #Diagram
-

Paint Splash Bar Chart Template – Market Analysis and Strategy
#Market and Competitor Analysis #Marketing Plan and Strategy #Graph
