Data Analysis PPT for Households with Pets
RJ0800040_8
- Last Update 08/11/2025
- File Size 0.5MB
- # of Slides 2
- File Format PPTX
- Slide Ratio 16:9
- Color
Keywords
- #Content-Based Slides
- #Design-Based Slides
- #Business Strategy
- #Market and Competitor Analysis
- #Graph
- #Achievements
- #Competitive Advantage
- #Column
- #Column Chart
- #16:9
- #pet market analysis PowerPoint
- #bar chart slide template
- #data visualization presentation
- #horizontal vertical bar graph
- #market research PPT
- #pet industry statistics slide
About the Product
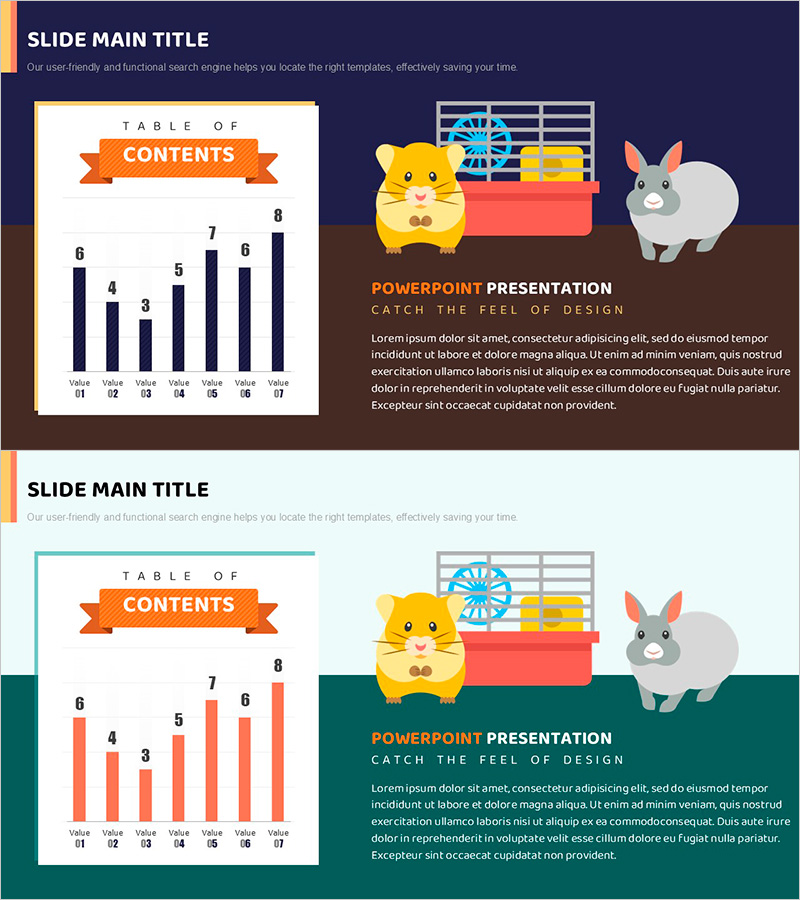
A 2-slide PowerPoint presentation visualizing pet household data with both horizontal and vertical bar charts. Features an orange ribbon banner header, cute pet illustrations, and clear comparison of 7 data items. The dark navy background with bright orange accent colors enhances data readability and visual impact. Ideal for market analysis, competitive positioning, and performance reporting presentations. All elements including colors, values, and labels are fully editable to match your specific data and branding requirements.
Usage Points
-
Main Usage
Designed to compare and analyze pet-related market data, household statistics, sales performance, and industry trends. Provides both horizontal and vertical bar formats to suit different data presentation needs, clearly contrasting 7 data points for maximum impact.
-
How to Use
Use in business reports, marketing plans, market analysis presentations, and performance reviews. Edit bar heights and colors to input actual data values, modify legend and axis labels to create customized charts matching your presentation context and audience.
-
Recommended For
Pet industry professionals, marketing managers, data analysts, business planners, and sales executives presenting market insights and performance metrics. Suitable for consumer statistics, sales trends, competitive analysis, and industry benchmarking presentations.
-
Slide Structure
Slide 1: Orange ribbon banner with 'TABLE OF CONTENTS' title and vertical bar chart displaying 7 data items. Slide 2: Same data presented as horizontal bar chart with pet character illustrations and text area. 16:9 widescreen format, PPTX file with all elements fully editable.
Related Products
-

Sports Vertical Bar Chart – The Perfect Choice for Performance Analysis
#Business Strategy #Market and Competitor Analysis #Graph
-

Visualizing Plant Growing Market Size – Achievements and Competitive Edge
#Business Strategy #Market and Competitor Analysis #Graph
-

Visually Enhanced Bar Graph by Promotional Product Performance
#Business Strategy #Market and Competitor Analysis #Graph
-

Data Comparison: Then vs. Now – Performance and Competitive Edge
#Business Strategy #Market and Competitor Analysis #Graph
