3D Shape Template Table for Financial Performance
RB0800019_16
- Last Update 03/21/2025
- File Size 2.5MB
- # of Slides 2
- File Format PPTX
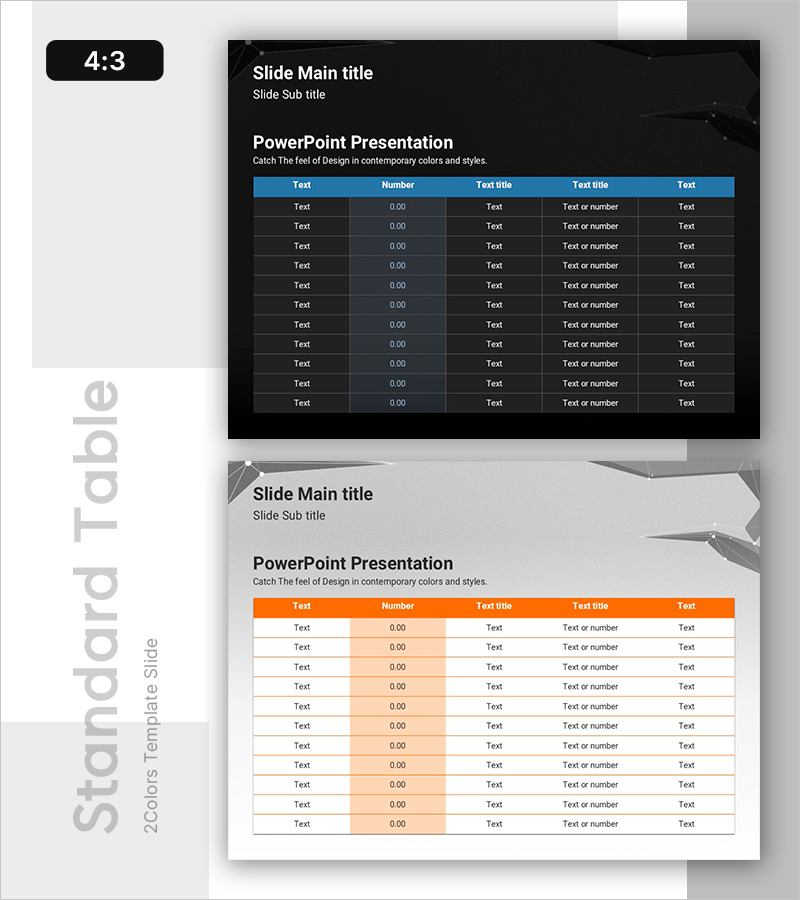
- Slide Ratio 4:3
- Color
Keywords
- #Content-Based Slides
- #Design-Based Slides
- #Financial Plans and Performance
- #Diagram
- #Projected Return on Investment (ROI)
- #Cash Flow Statement
- #Table
- #Standard Table
- #4:3
- #data table PowerPoint slide
- #financial performance template
- #ROI slide design
- #cash flow statement PowerPoint
- #how to create data table in PowerPoint
About the Product
A 5-column data table PowerPoint slide designed to visualize financial performance and return on investment metrics. The blue header row and dark gray data rows enhance readability for numerical information, making it ideal for cash flow statements, ROI projections, and quarterly performance comparisons. This 2-slide template provides flexible data layouts and is fully editable in PPTX format for immediate use.
Usage Points
-
Main Usage
Organize and compare financial metrics including performance data, ROI projections, and cash flow information in a structured format. The clear row and column separation enables stakeholders to quickly understand complex financial data at a glance.
-
How to Use
Apply to quarterly performance reviews, departmental budget reports, ROI analysis, and cash flow projections in financial presentations. Simply input your text and numerical data directly into the editable table cells for immediate deployment.
-
Recommended For
Ideal for CFOs, finance managers, executives, and investor presentations. Recommended for business plans, quarterly earnings reports, investment pitch decks, and financial analysis documents where credible data visualization is essential.
-
Slide Structure
Structured as a 12-row table with 5 columns (Text, Number, Text title, Text title, Text). Blue header row contrasts with dark gray data rows to establish clear information hierarchy. Two-slide template offers multiple table layout variations for different data presentation needs.
Related Products
-

Simple Circle Presentation Template Doughnut Chart – Visualizing Financial Performance
#Financial Plans and Performance #Diagram #Graph
-

Origami Presentation Template Section Table – Showcase Financial Performance
#Financial Plans and Performance #Diagram #Cash Flow Statement
-

Business Plan PowerPoint Design – Excel Table Utilization
#Financial Plans and Performance #Diagram #Balance Sheet
-

Perfect Presentation Template for Financial Performance Visualization with Table Design
#Financial Plans and Performance #Diagram #Cash Flow Statement
