Toy Image and Table – Emphasizing Financial Planning
RJ0500003_10
- Last Update 06/08/2025
- File Size 4.1MB
- # of Slides 2
- File Format PPTX
- Slide Ratio 16:9
- Color
Keywords
- #Content-Based Slides
- #Design-Based Slides
- #Financial Plans and Performance
- #Diagram
- #Projected Return on Investment (ROI)
- #Sales and Revenue
- #Table
- #Standard Table
- #16:9
- #data table slide
- #financial performance PowerPoint
- #comparison table template
- #4-row table slide
- #financial metrics presentation
- #ROI analysis slide
About the Product
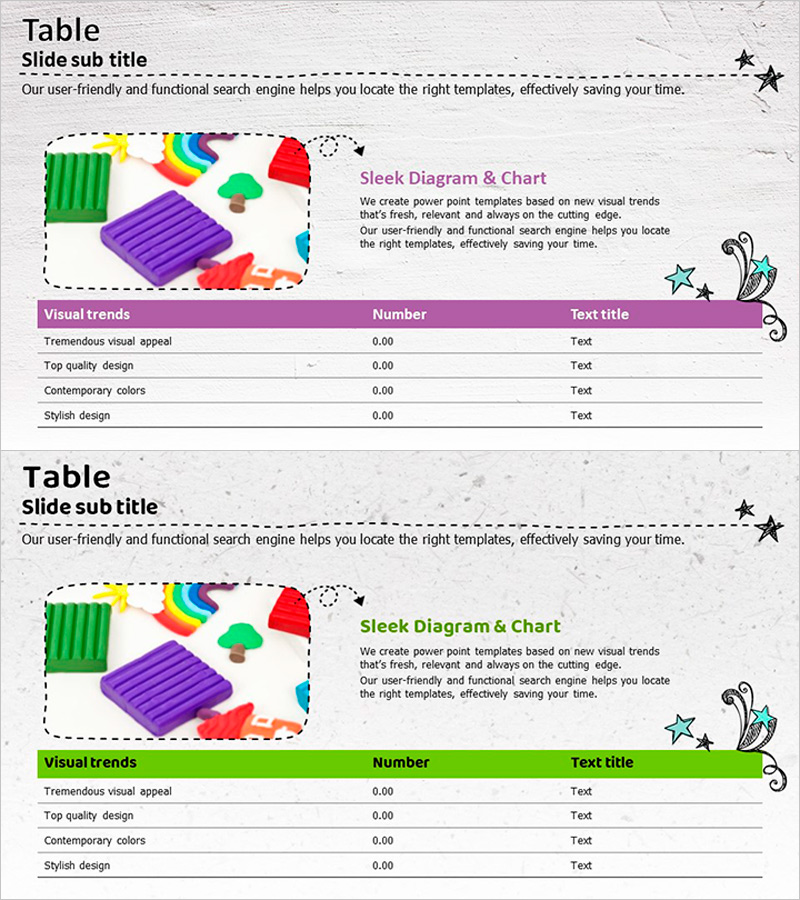
A two-slide PowerPoint presentation featuring a 4-row data table for comparing financial metrics and performance indicators. The left side displays colorful toy imagery, while the right side presents a structured table with three columns: 'Visual Trends', 'Number', and 'Text Title'. The table headers are highlighted in purple and green, making it ideal for organizing revenue figures, ROI, and financial performance data. Delivered in 16:9 widescreen PPTX format, this slide deck is fully editable and ready for immediate use in business presentations, investor pitches, and financial reports.
Usage Points
-
Main Usage
Organize and visually compare financial data including revenue figures, ROI, performance metrics, and budget allocations in a structured table format. The two-column layout (image + table) enhances information clarity and audience engagement during financial presentations.
-
How to Use
Ideal for business plans, investor presentations, quarterly earnings reports, and financial analysis meetings. Easily customize table rows and columns to accommodate different data structures. Simply replace placeholder text and numbers with your actual financial figures and metrics.
-
Recommended For
CFOs, financial analysts, business planners, investment managers, and executives presenting quarterly results, budget reviews, ROI analysis, cost breakdowns, and financial forecasts to stakeholders and investors.
-
Slide Structure
Two-slide deck: Slide 1 features purple-header table (4 rows × 3 columns), Slide 2 features green-header table (4 rows × 3 columns). Each slide includes colorful toy imagery on the left and data entry fields on the right with 12 editable cells per slide (rows × columns).
Related Products
-

Financial Planning and Scorecard Blue Orange
#Financial Plans and Performance #Diagram #Projected Return on Investment (ROI)
-

Simple Circle Presentation Template Doughnut Chart – Visualizing Financial Performance
#Financial Plans and Performance #Diagram #Graph
-

Color-highlighted Bar Graphs and Tables – Optimized for Financial Analysis
#Financial Plans and Performance #Diagram #Graph
-

Summer Vacation Template Table – Visualizing Financial Performance
#Financial Plans and Performance #Diagram #Projected Return on Investment (ROI)
