Effective Data Table Slide – Financial Planning and Performance
RB0800013_15
- Last Update 03/20/2025
- File Size 7.1MB
- # of Slides 2
- File Format PPTX
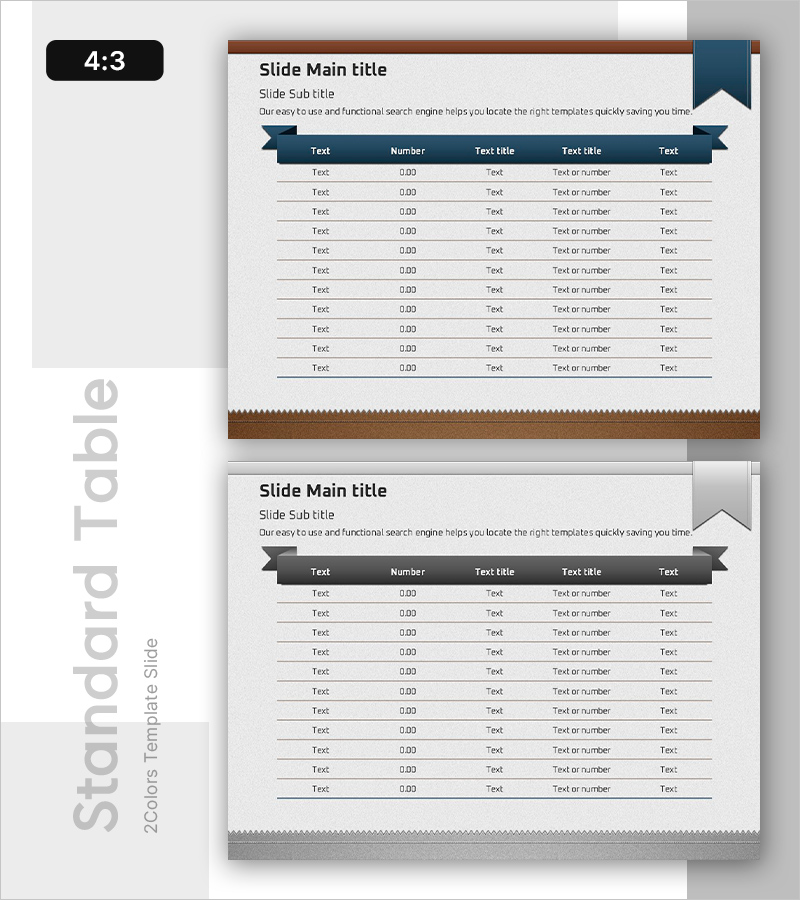
- Slide Ratio 4:3
- Color
Keywords
About the Product
A professional data table PowerPoint slide designed for comparing financial planning and performance metrics. The horizontal table structure features five columns (Text, Number, Text title, Text title, Text) with ten rows for data entry, enabling systematic organization of financial figures, percentages, and descriptive information. The dark blue header banner with white typography provides clear visual hierarchy, while the brown decorative top border and gray bottom frame add premium presentation quality. Includes 2 slides in 4:3 aspect ratio compatible with all standard projector environments. Ideal for financial reports, quarterly performance analysis, budget planning presentations, and investor relations materials.
Usage Points
-
Main Usage
Organize financial data, sales figures, budget items, and performance indicators in a structured row-and-column format for immediate comparison. The dark blue header banner emphasizes table titles and column labels, while ten data rows accommodate substantial information volume without overcrowding.
-
How to Use
Input text, numerical values, percentages, and metrics into each cell for financial reports, quarterly performance analysis, and budget-versus-actual comparison slides. Edit header text and data rows to customize the table format for different reporting scenarios and data types.
-
Recommended For
CFOs, finance managers, and executives presenting financial reports. Effective for quarterly results analysis, budget planning presentations, investor relations meetings, internal performance reviews, and board-level financial discussions requiring data credibility.
-
Slide Structure
Two-slide set with each slide containing five columns and ten data entry rows. Dark blue header banner with white text, gray dividing lines, and brown decorative top border establish clear information hierarchy. 4:3 aspect ratio ensures compatibility across all standard presentation environments and display systems.
Related Products
-

Cost Table by Beans – Unique Financial Analysis
#Financial Plans and Performance #Diagram #Sales and Revenue
-

Blue Line Wide Template Table1
#Financial Plans and Performance #Diagram #Sales and Revenue
-

Minimal Block Table for Revenue and Profit Analysis – Emphasizing Financial Performance
#Financial Plans and Performance #Diagram #Sales and Revenue
-

Sales and Profit Table – Statistical Financial Performance
#Financial Plans and Performance #Diagram #Sales and Revenue
