Insight Summary Table – Visualizing Financial Plans and Performance
RB0800017_15
- Last Update 03/21/2025
- File Size 1.7MB
- # of Slides 2
- File Format PPTX
- Slide Ratio 4:3
- Color
Keywords
- #Content-Based Slides
- #Design-Based Slides
- #Financial Plans and Performance
- #Diagram
- #Income Statement
- #Key Financial Indicators
- #Table
- #Standard Table
- #4:3
- #data table PowerPoint slide
- #financial comparison template
- #performance metrics slide
- #numerical data visualization
- #spreadsheet PowerPoint design
About the Product
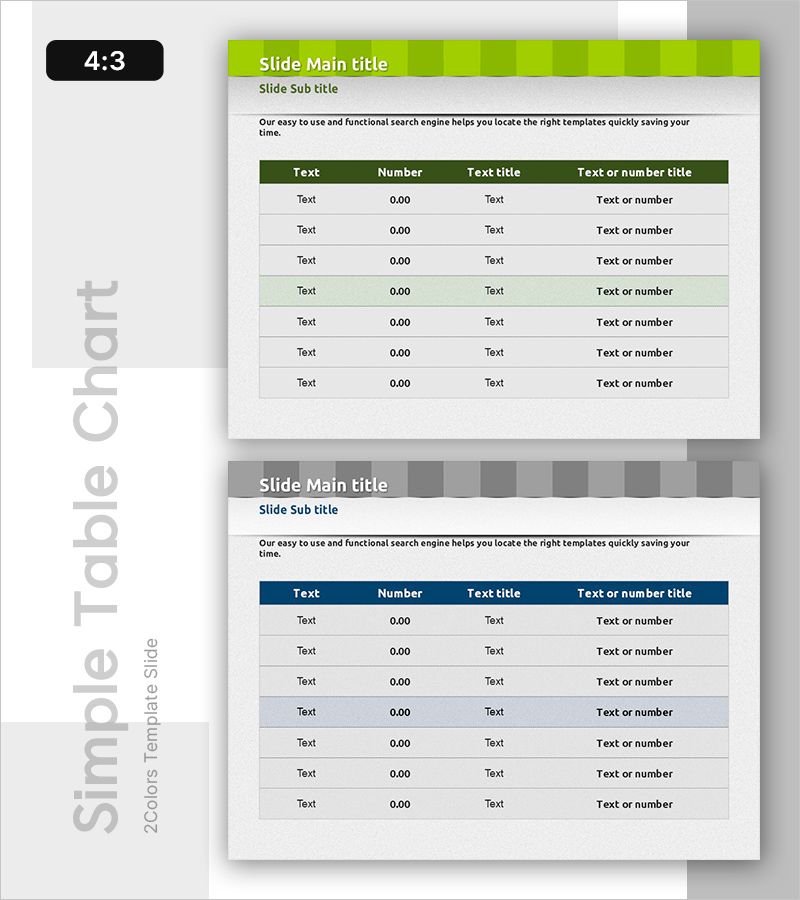
A 7-row, 4-column data table PowerPoint slide designed for comparing financial plans and performance metrics at a glance. The dual-tone header in lime green and dark green clearly establishes information hierarchy, while separate columns for numerical input and text descriptions optimize the layout for financial figures, performance indicators, and target comparisons. The 4:3 aspect ratio with 2-slide set integrates seamlessly into presentations, reports, and planning documents. Alternating row background colors enhance data readability and visual organization.
Usage Points
-
Main Usage
Organize financial plans, actual performance, and target values in a structured matrix format to enable clear numerical comparison and analysis. Separate columns for data entry and descriptive text allow systematic arrangement of complex datasets.
-
How to Use
Use in business plans, financial reports, and performance presentations to display quarterly results, budget versus actual spending, and goal achievement rates. Customize header text and data cells to create comparative tables for projects, departments, or product performance tracking.
-
Recommended For
Finance professionals, executives, and project managers preparing periodic reports, analytical materials, and decision-making documents. Particularly effective for quarterly or monthly performance trends, budget execution status, and KPI achievement comparisons.
-
Slide Structure
7-row × 4-column table with dual-tone header (lime and dark green), alternating data rows (white and light lime), and mixed numerical-text input areas. Two-slide set enables multiple dataset presentations with 4:3 aspect ratio for broad compatibility.
Related Products
-

Illustration Theme Income Statement Table – Visualization of Financial Performance
#Financial Plans and Performance #Diagram #Income Statement
-

Key Financial Indicators Table – Effective Data Presentation
#Financial Plans and Performance #Diagram #Income Statement
-

Income Statement Table – Clearly Presenting Financial Plans and Performance
#Financial Plans and Performance #Diagram #Income Statement
-

Key Financial Indicators Table – Clear Profit Analysis
#Financial Plans and Performance #Diagram #Income Statement
