3D Area Chart (Green & Blue) – New Possibilities in Data Visualization
RB0800017_13
- Last Update 03/21/2025
- File Size 1.7MB
- # of Slides 2
- File Format PPTX
- Slide Ratio 4:3
- Color
Keywords
About the Product
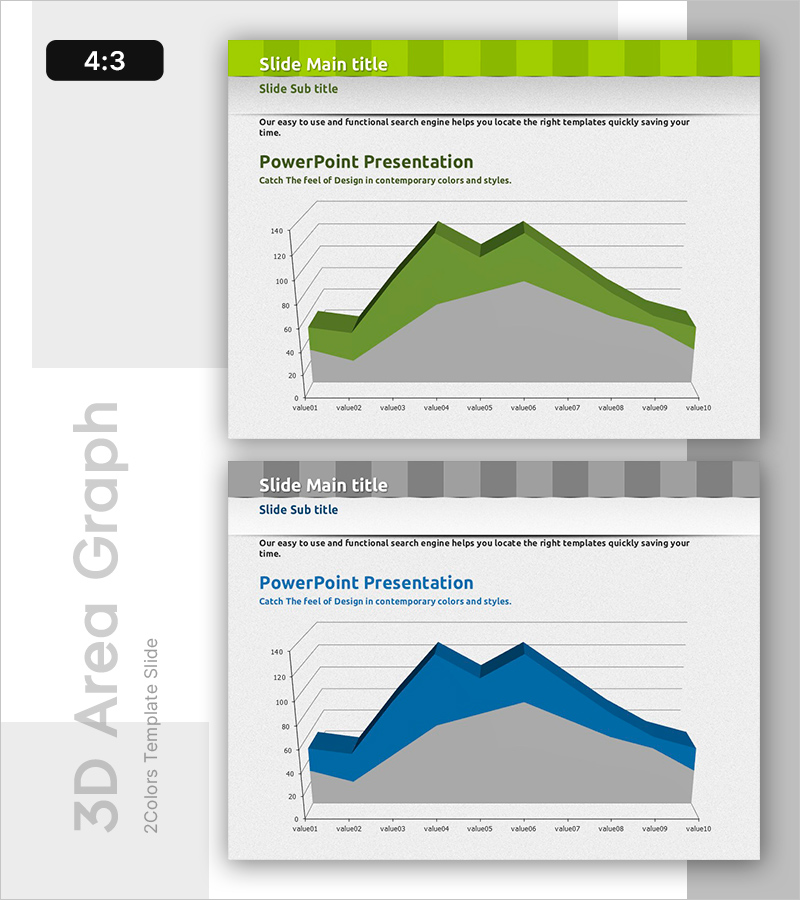
A three-dimensional area chart PowerPoint slide that displays multiple data series with clear visual distinction using green and blue color gradients. This presentation template effectively represents trends across 10 data points, making it ideal for quarterly reports, performance analysis, and marketing presentations. The dual-layer area design creates depth and visual impact while maintaining data clarity. Simply input your numerical values and the chart updates automatically. The 2-slide set offers flexibility for different presentation contexts and can be customized to match your corporate branding.
Usage Points
-
Main Usage
Visualize quarterly or monthly revenue trends, departmental performance comparisons, market share evolution, and customer satisfaction metrics across two or more data series. The three-dimensional rendering adds visual impact to executive presentations and analytical reports.
-
How to Use
Input your data into the value01 through value10 fields and the chart automatically recalculates. Customize the green and blue colors to match your corporate palette, adjust axis labels and legend text to fit your presentation context. The 4:3 aspect ratio ensures compatibility with standard presentation systems.
-
Recommended For
Financial analysts, marketing professionals, business executives, management consultants, and academic presenters who need to communicate quantitative trends persuasively. Particularly suited for presentations requiring trend analysis, year-over-year comparisons, and multi-variable performance tracking.
-
Slide Structure
Two-slide template featuring identical 3D area chart layouts. Each slide displays three overlapping areas: green series (top), blue series (middle), and gray baseline (bottom). Y-axis ranges from 0 to 140, X-axis contains 10 data points (value01–value10) with gridlines for easy reference.
Related Products
-

User Analysis Graph by Age Group – Advanced Data Insights
#Market and Competitor Analysis #Diagram #Graph
-

Marketing Survey Results – Data Visualization Graph
#Graph
-

Black Navy Broken Line Graph Table – Market and Competitor Analysis
#Market and Competitor Analysis #Diagram #Graph
-

Horizontal Bar Graph of Component Analysis Results
#Business Strategy #Market and Competitor Analysis #Graph
