Market Trends by Item Graph – An Optimal Tool for Market Analysis
RJ0900022_11
- Last Update 08/22/2025
- File Size 0.3MB
- # of Slides 2
- File Format PPTX
- Slide Ratio 16:9
- Color
Keywords
- #Content-Based Slides
- #Design-Based Slides
- #Market and Competitor Analysis
- #Graph
- #Industry Trends
- #Horizontal Bar
- #Segmented Horizontal Bar
- #16:9
- #horizontal bar chart PowerPoint
- #market trends slide template
- #data comparison presentation
- #bar graph template download
- #market analysis PowerPoint slide
About the Product
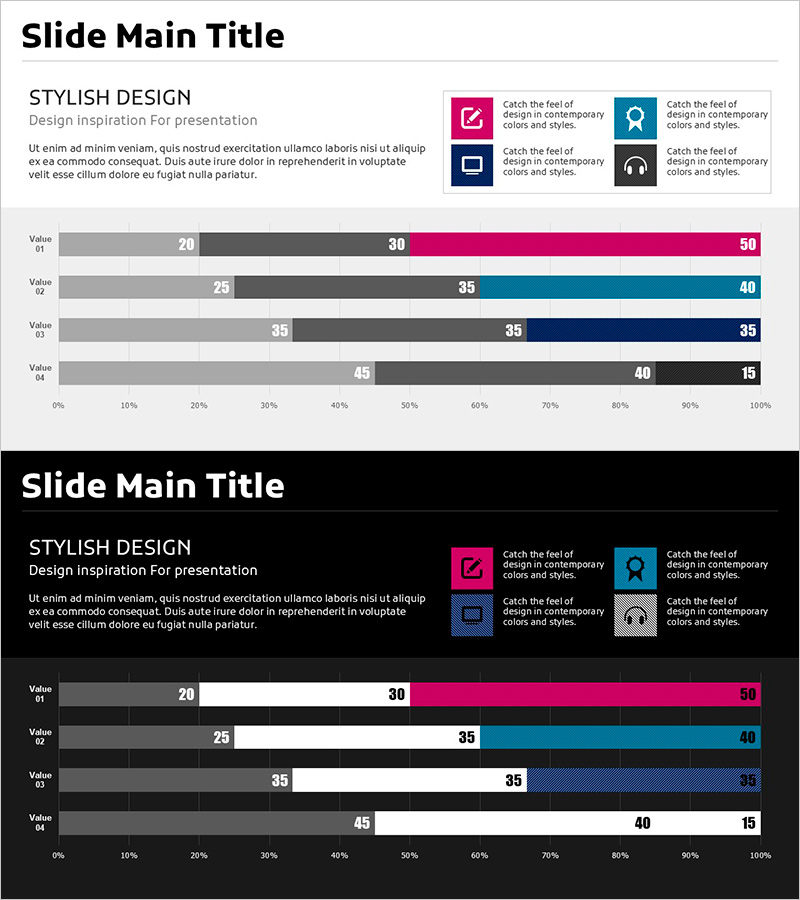
A horizontal bar chart PowerPoint slide optimized for market analysis and competitive comparison. This presentation template displays four data series side by side, with magenta, teal, and navy colors distinguishing each item clearly. Designed for 16:9 widescreen format, the slide ensures excellent visibility during presentations, with numerical labels prominently displayed for accurate data communication. Ideal for business reports, marketing plans, investor presentations, and any data-driven pitch requiring comparative analysis.
Usage Points
-
Main Usage
Displays four data series in horizontal bar format for direct comparison of market trends, sales performance, competitor metrics, and other quantitative information. Each series uses a distinct color, enabling audiences to instantly recognize differences and relationships between data points without complex interpretation.
-
How to Use
Insert this slide into the market analysis section of business reports, competitive landscape pages of marketing plans, or performance comparison slides in investor presentations. The horizontal layout allows viewers to read category labels easily on the left while comparing bar lengths across multiple series, making complex data intuitive and actionable.
-
Recommended For
Marketing managers, business strategists, financial analysts, sales directors, and executives who present data-driven insights. Suitable for quarterly performance reviews, market positioning analysis, competitive benchmarking, and any presentation requiring multi-series numerical comparison.
-
Slide Structure
Two-slide set featuring identical layouts in light and dark backgrounds. Each slide displays four horizontal bars with distinct colors (magenta, teal, navy, gray) and numerical value labels at bar endpoints. The dark version accommodates various presentation environments and projection conditions.
Related Products
-

Work and Home Life Graph – Market Trends and Design Sensibility
#Market and Competitor Analysis #Graph #Industry Trends
-

Yellow Green Detailed Analysis Chart - Visualizing Market Trends
#Business Strategy #Market and Competitor Analysis #Diagram
-

Memorable Travel Destinations Survey Slide – Market and Competitive Analysis
#Market and Competitor Analysis #Graph #Industry Trends
-

Analyzing Flower Horizontal Segmentation Charts – Understanding Market Trends
#Market and Competitor Analysis #Graph #Industry Trends
