Area Charts and Text Boxes – Data Analysis and Visualization
RJ0900019_20
- Last Update 08/21/2025
- File Size 0.3MB
- # of Slides 2
- File Format PPTX
- Slide Ratio 16:9
- Color
Keywords
About the Product
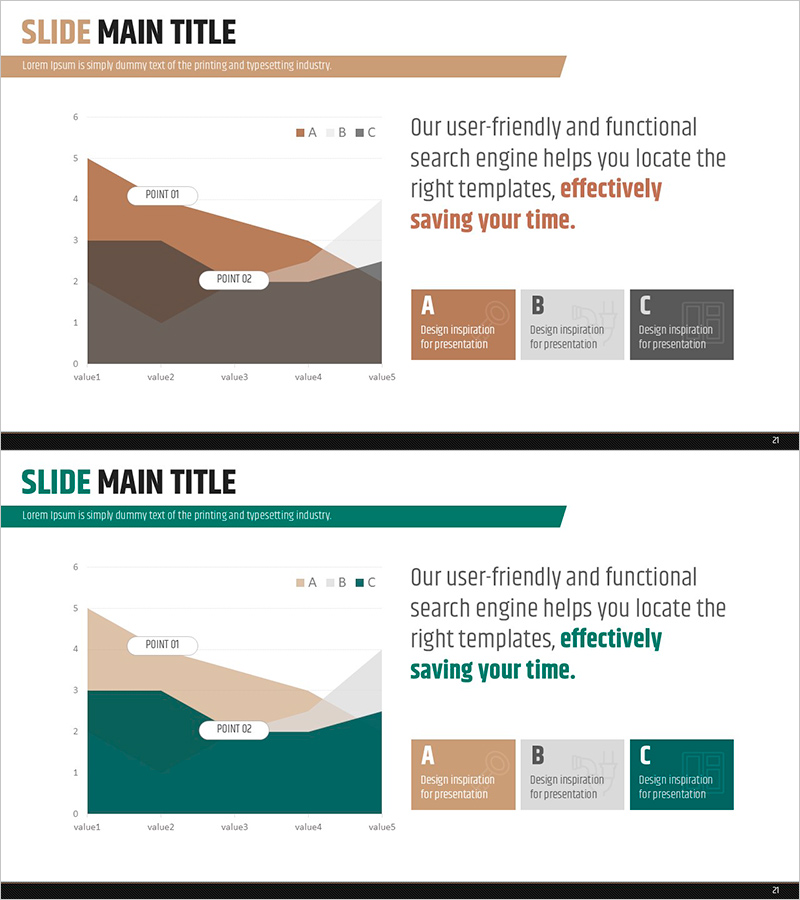
A professional data visualization PowerPoint slide combining area charts with text boxes for comprehensive analysis presentation. The area chart displays five data points across two series with smooth gradient fills in brown, gray, and beige tones, effectively showing trends and cumulative values over time. Three text boxes on the right side highlight key insights and conclusions. This PowerPoint slide template is ready to use for business reports, financial analysis, market research presentations, and executive dashboards requiring multi-series trend visualization.
Usage Points
-
Main Usage
Visualize time-series data trends and cumulative values using a two-series area chart, with three text boxes emphasizing key findings and analysis results. The overlapping gradient areas enable intuitive comparison between data series.
-
How to Use
Apply this slide in financial reports, quarterly performance reviews, sales trend analysis, and market research presentations. Replace sample data in the area chart with your actual figures, and update the three text boxes with key insights, conclusions, and action items for your audience.
-
Recommended For
Finance teams, marketing departments, sales managers, and executives preparing data-driven presentations. Ideal for quarterly results comparison, customer growth trends, market share evolution, cost-benefit analysis, and any business presentation requiring multi-series trend visualization.
-
Slide Structure
Left side features an area chart with five X-axis values and two Y-axis series (A and B) displayed with gradient fills. Right side contains three color-coded text boxes (A, B, C) aligned with chart series. Brown, gray, and beige gradient areas distinguish data series for clear visual hierarchy.
Related Products
-

Competitor Analysis Graph & Mobile Phone Mockup – Snapshot of Market Trends
#Market and Competitor Analysis #Graph #Other
-

Current Status of Global Target Market Analysis – Strategic Insights through Data Visualization
#Company Introduction #Marketing Plan and Strategy #Graph
-

Bar Chart & Income Statement Table – Market Analysis and Financial Performance
#Market and Competitor Analysis #Financial Plans and Performance #Diagram
-

User Gender Ratio Analysis Graph – Customer Insights
#Market and Competitor Analysis #Graph #Customer Analysis
