Column Chart for PowerPoint – Visualization of Market Analysis and Performance
RB0800007_7
- Last Update 03/18/2025
- File Size 0.2MB
- # of Slides 2
- File Format PPTX
- Slide Ratio 4:3
- Color
Keywords
- #Content-Based Slides
- #Design-Based Slides
- #Market and Competitor Analysis
- #Financial Plans and Performance
- #Graph
- #Market Status
- #Sales and Revenue
- #Column
- #Column Chart
- #4:3
- #column chart PowerPoint
- #vertical bar graph slide
- #data comparison presentation
- #market analysis chart
- #performance visualization slide
About the Product
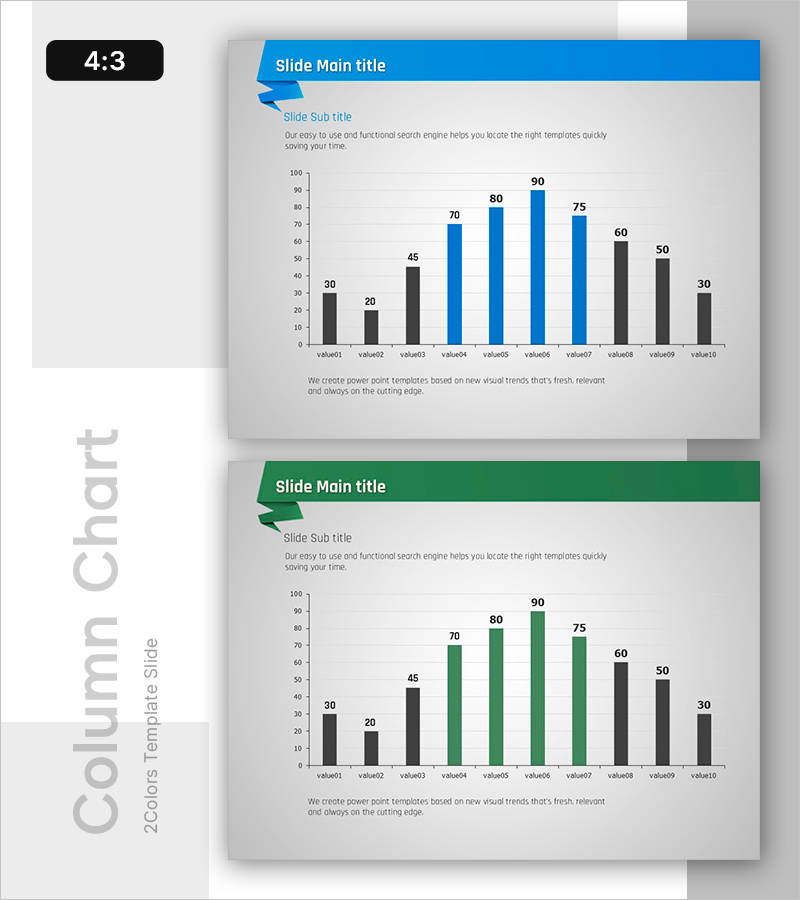
A vertical column chart PowerPoint slide designed to visualize market analysis and financial performance data at a glance. The two-tone color scheme—blue for primary metrics and gray for comparative data—ensures clear differentiation across 10 data points. Each slide includes dedicated areas for title, subtitle, and descriptive text, making it easy to add presentation context. This 4:3 aspect ratio template with 2 slides is ready to use immediately in any presentation environment.
Usage Points
-
Main Usage
Ideal for comparing multiple data points such as market analysis, sales performance, financial results, and departmental KPIs. The blue and gray color distinction makes it easy for audiences to identify primary metrics versus comparative benchmarks, enhancing comprehension during executive presentations.
-
How to Use
Enter your analysis topic in the slide title (e.g., 'Quarterly Sales Performance') and specify the time period in the subtitle. Replace the numeric labels on each column with your actual data values. The color scheme can be easily customized to match your corporate branding without affecting the chart structure.
-
Recommended For
Executive reports, quarterly performance reviews, market research presentations, departmental KPI assessments, investor relations meetings, marketing performance analysis, and any data-driven presentation requiring quantitative comparison across multiple categories.
-
Slide Structure
Two-slide template with blue header banner on the first slide and green header on the second, each featuring a 10-item vertical column chart. Both slides include dedicated areas for title, subtitle, and explanatory text to support your narrative.
Related Products
-

AI VC Market Statistics PowerPoint Slide – Bar Chart and KPI
#Market and Competitor Analysis #Financial Plans and Performance #Graph
-

Simple & Modern Wide PowerPoint Vertical Bar Chart
#Market and Competitor Analysis #Financial Plans and Performance #Graph
-

Key Growth Drivers KPI Slide – Revenue, Efficiency, Customers
#Market and Competitor Analysis #Financial Plans and Performance #Graph
-

Basic Vertical Bar Chart Slide – Market Status Analysis
#Market and Competitor Analysis #Financial Plans and Performance #Graph
