Key Growth Drivers KPI Slide – Revenue, Efficiency, Customers
RM0100024_15
- Last Update 12/21/2025
- File Size 12.4MB
- # of Slides 2
- File Format PPTX
- Slide Ratio 16:9
- Color
Keywords
- #Content-Based Slides
- #Market and Competitor Analysis
- #Financial Plans and Performance
- #Graph
- #Market Status
- #Sales and Revenue
- #Column
- #Column Chart
- #16:9
- #KPI bar chart PowerPoint
- #business metrics slide template
- #quarterly performance dashboard
- #executive presentation slides
- #growth indicators PowerPoint template
About the Product
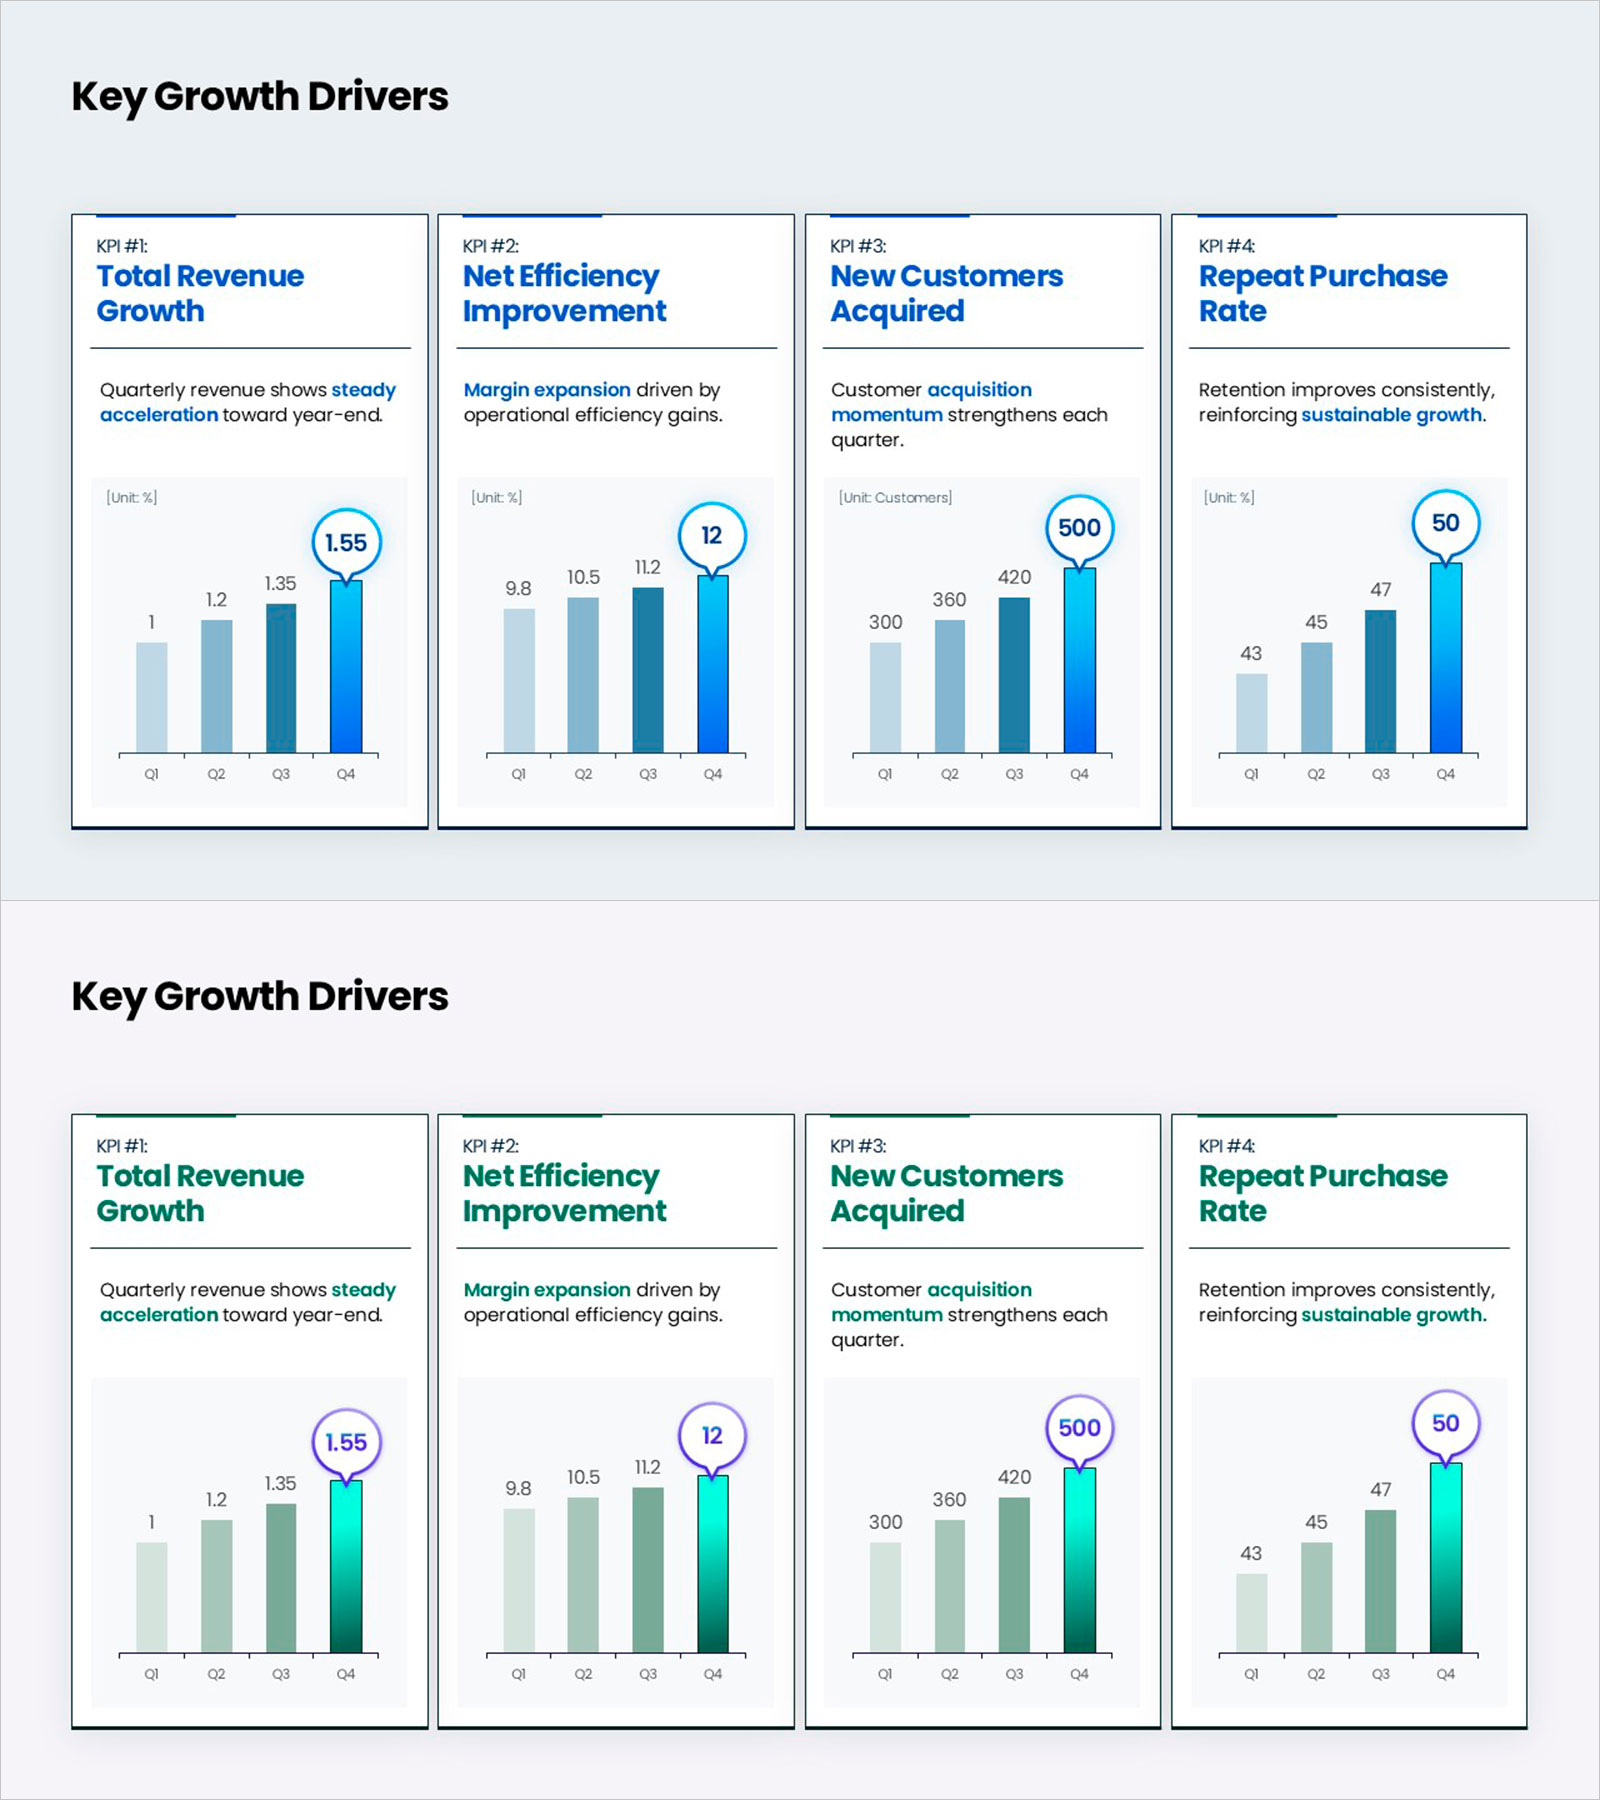
A comprehensive PowerPoint slide featuring four key performance indicators (KPIs) visualized as bar charts to track quarterly business growth. This slide presents Total Revenue Growth, Net Efficiency Improvement, New Customers Acquired, and Repeat Purchase Rate in a 2×2 grid layout, making it ideal for executive presentations, quarterly business reviews, and investor meetings. Each chart displays quarterly progression (Q1 through Q4) with clear data labels and highlighted peak values. The design uses a blue gradient color scheme with professional typography and ample white space for easy readability. Two slide variations—one in blue tones and one in green tones—allow you to match your corporate brand identity. All chart values, labels, and text fields are fully editable, enabling you to input your actual business data and customize the presentation instantly.
Usage Points
-
Main Usage
Simultaneously display four critical business KPIs in a single slide to provide a comprehensive view of organizational performance. The bar chart format enables quick comparison of quarterly trends and progress toward targets, supporting data-driven decision-making for executives, investors, and stakeholders.
-
How to Use
Use this slide in executive board meetings, quarterly earnings presentations, investor relations (IR) sessions, and strategic planning reviews. Replace the sample data with your actual quarterly figures, adjust chart labels and legends, and select the color variant (blue or green) that matches your corporate branding. All elements are fully editable in PowerPoint.
-
Recommended For
CFOs, C-suite executives, business unit leaders, marketing directors, sales managers, strategy teams, financial analysts, and HR leaders responsible for performance tracking and reporting. Particularly valuable for quarterly business reviews, investor presentations, internal management meetings, and annual performance assessments.
-
Slide Structure
Slide 1 (Blue variant): Four KPI charts arranged in a 2×2 grid. Each chart is a horizontal bar graph displaying Q1–Q4 quarterly data with four data series per metric. Peak values are highlighted with circular badges. Slide 2 (Green variant): Identical layout and structure with alternative color scheme for brand flexibility. All text, numerical values, and colors are fully customizable.
Related Products
-

Purple Green Flower Market Analysis – Market Status and Competitive Analysis
#Market and Competitor Analysis #Financial Plans and Performance #Graph
-

Vertical Bar Column Chart (Orange & Green) – Visualizing Sales Performance
#Market and Competitor Analysis #Financial Plans and Performance #Graph
-

Basic Vertical Bar Chart Slide – Market Status Analysis
#Market and Competitor Analysis #Financial Plans and Performance #Graph
-

Column Chart for PowerPoint – Visualization of Market Analysis and Performance
#Market and Competitor Analysis #Financial Plans and Performance #Graph
