Feedback Donut Chart Comparison Analysis – Capturing Customer Voices and Success
RB0800012_8
- Last Update 03/20/2025
- File Size 3.8MB
- # of Slides 2
- File Format PPTX
- Slide Ratio 4:3
- Color
Keywords
- #Content-Based Slides
- #Design-Based Slides
- #Market and Competitor Analysis
- #Customer Success Stories
- #Graph
- #Competitive Advantage
- #Customer Testimonials and Feedback
- #Circles
- #Doughnut Chart
- #4:3
- #donut chart PowerPoint slide
- #pie chart comparison template
- #customer feedback presentation
- #data visualization slides
- #how to create donut chart in PowerPoint
About the Product
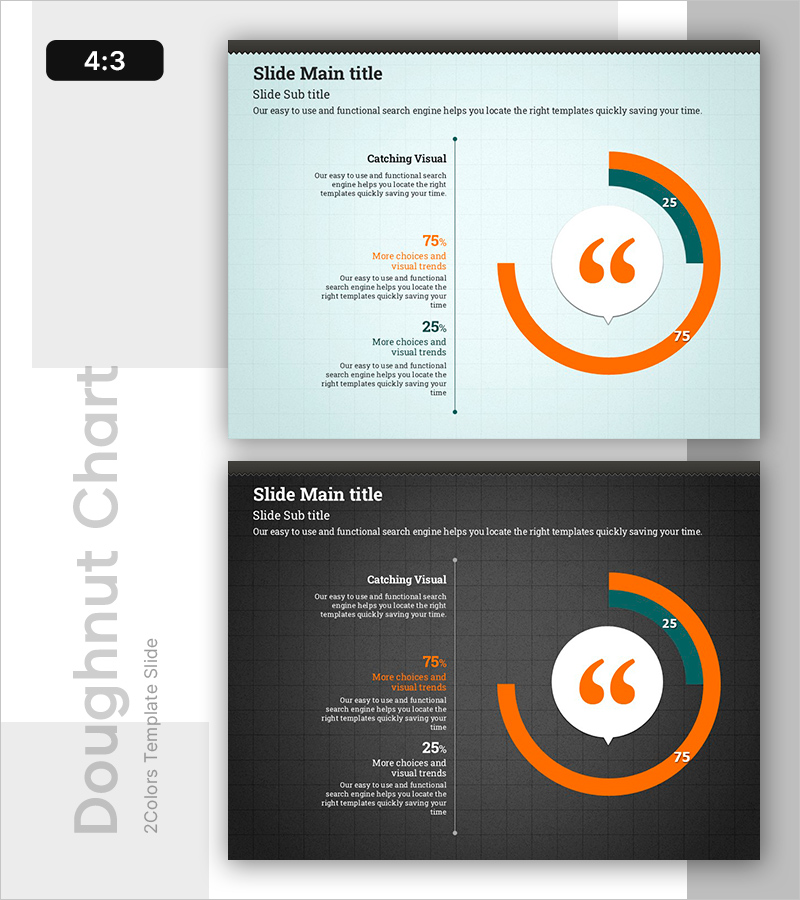
A donut chart PowerPoint slide template designed to visually compare customer feedback and success metrics. The light blue background features two donut charts in orange and dark green tones, enabling simultaneous representation of two data series. The center area includes a quotation mark zone for inserting key messages, while the left text section accommodates detailed descriptions for each metric. This 4:3 ratio, 2-slide template is ready for immediate use in presentations.
Usage Points
-
Main Usage
Visualize customer feedback data and success indicators in ratio format for clear executive and team communication. The donut chart's center area emphasizes key messages or testimonials, amplifying storytelling impact and audience engagement.
-
How to Use
Enter metric descriptions in the left text area (e.g., '75% More Choices and Visual Trends'), then replace donut chart values (25, 75) with actual data. Insert customer success stories or critical statistics in the center quotation zone to maximize presentation impact.
-
Recommended For
Ideal for marketing, sales, and customer success teams presenting quarterly or annual performance reports, customer satisfaction analysis, and product improvement strategies. Suitable for executive briefings, investor pitches, and team meetings.
-
Slide Structure
2-slide layout with light blue background. Each slide divides into left text area (title and three-tier descriptions) and right donut chart section. Dual-series donuts in orange and dark green with center quotation mark and message input zone. 4:3 ratio PPTX format.
Related Products
-

Status Donut Chart Slide – A Powerful Tool for Data Analysis
#Product/Service Introduction #Market and Competitor Analysis #Graph
-

Pizza and Competition Graph – Market Analysis Essential
#Market and Competitor Analysis #Graph #Competitive Advantage
-

Running Silhouette Donut Chart
#Market and Competitor Analysis #Graph #Market Share
-

Visualizing Competitive Advantage with Circular Gauge Charts
#Product/Service Introduction #Market and Competitor Analysis #Graph
