Running Silhouette Donut Chart
RJ0800021_5
- Last Update 08/05/2025
- File Size 0.2MB
- # of Slides 2
- File Format PPTX
- Slide Ratio 16:9
- Color
Keywords
- #Content-Based Slides
- #Design-Based Slides
- #Market and Competitor Analysis
- #Graph
- #Market Share
- #Competitive Advantage
- #Circles
- #Doughnut Chart
- #16:9
- #donut chart PowerPoint
- #pie chart slide template
- #ratio visualization
- #market share chart
- #graph PowerPoint slide
- #data visualization presentation
- #percentage comparison slide
About the Product
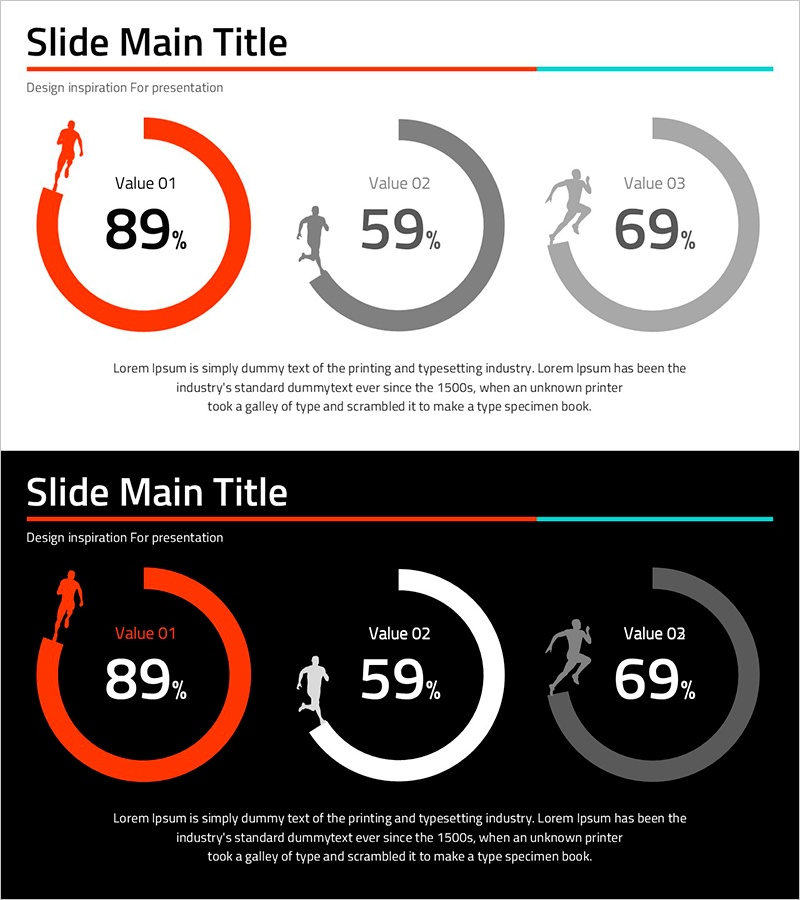
A PowerPoint slide featuring a running silhouette motif integrated with donut charts for effective data visualization. The three-color design—orange, white, and gray—displays market share, competitive advantage, and performance ratios with clarity and impact. Silhouette icons positioned above each chart reinforce the meaning of the data, making it ideal for business presentations and reports. This 2-slide template in 16:9 widescreen PPTX format is fully editable and ready for immediate use in your presentation deck.
Usage Points
-
Main Usage
Designed to display three data points—market share, competitive advantage, performance metrics, or composition ratios—using circular graphs. The silhouette icons enhance the meaning of each dataset and increase presentation credibility.
-
How to Use
Perfect for business presentations, marketing reports, strategic planning documents, and quarterly performance reviews. Simply edit the percentage values and labels with your own data to create a professional data visualization in seconds.
-
Recommended For
Marketing managers, sales directors, executives, consultants, and data analysts presenting market analysis, performance reviews, and strategic initiatives. Ideal when comparing three data categories simultaneously with visual impact.
-
Slide Structure
Two-slide template with three donut charts arranged horizontally on each slide. Each chart features a running silhouette icon above it, with percentage values centered in the chart and descriptive text below. The layout supports easy data entry and clear interpretation of comparative metrics.
Related Products
-

Fashion Design Comparative Donut Chart – Market Share Analysis
#Market and Competitor Analysis #Graph #Market Share
-

Sharing vs Housing Insights Chart – Market Share and Competitive Advantage
#Market and Competitor Analysis #Graph #Market Share
-

Circle Donut Market Share Graph – Visual Elements for Market Analysis
#Market and Competitor Analysis #Graph #Market Share
-

Donut Chart Slide Visualizing Social Media Market Share
#Market and Competitor Analysis #Graph #Market Share
