Market Competitive Advantage Analysis with Donut Graph
RJ0700017_20
- Last Update 07/26/2025
- File Size 0.5MB
- # of Slides 2
- File Format PPTX
- Slide Ratio 16:9
- Color
Keywords
- #Content-Based Slides
- #Design-Based Slides
- #Market and Competitor Analysis
- #Diagram
- #Graph
- #Market Analysis
- #Competitive Advantage
- #Cluster
- #Circles
- #Chain Diagram
- #Doughnut Chart
- #16:9
- #donut chart PowerPoint
- #pie chart slide template
- #market analysis presentation
- #competitive advantage analysis PPT
- #percentage visualization PowerPoint
About the Product
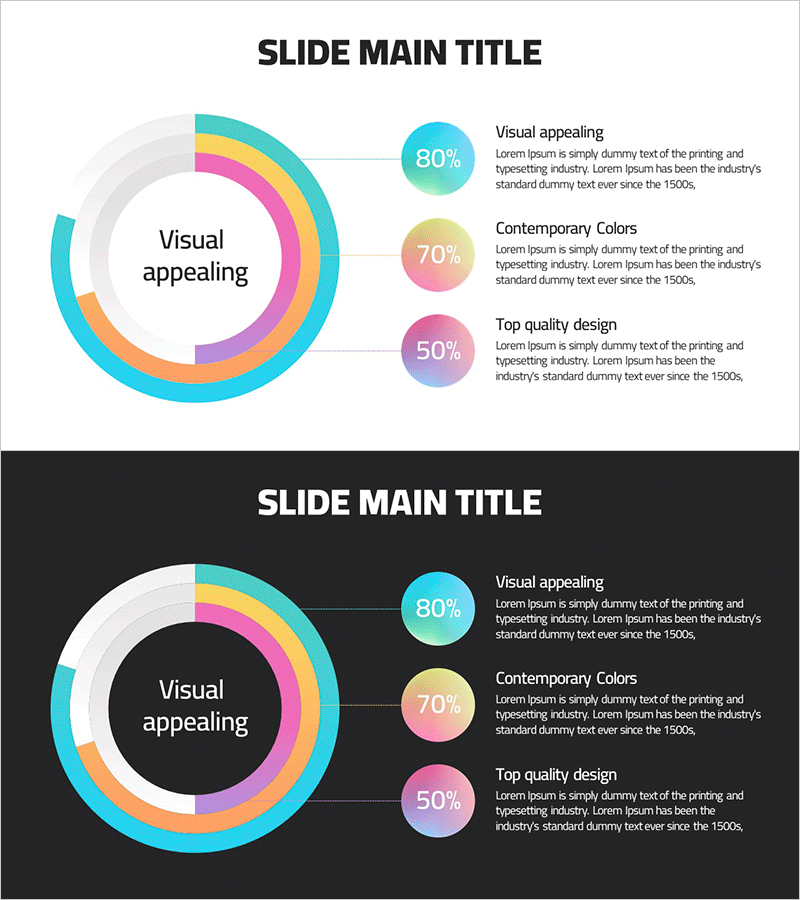
A professional donut chart PowerPoint slide designed for analyzing market competitive advantage with three distinct segments. The slide features a vibrant color palette including teal, pink, orange, and purple, with percentage values (80%, 70%, 50%) displayed for each segment. The center of the donut ring provides space for a core message, while the right side includes three circular badges with corresponding descriptive text. This 2-slide, 16:9 aspect ratio PPTX template is fully editable and ready for immediate use in data-driven presentations.
Usage Points
-
Main Usage
Visualize and compare three key metrics such as market competitive advantage, product strengths, or customer satisfaction levels using proportional donut segments. The donut structure emphasizes a central message while clearly displaying segment percentages, making it ideal for executive reports, marketing strategy presentations, and business performance analysis.
-
How to Use
Input percentage values into each of the three donut segments and add your analysis topic (e.g., Visual appealing) in the center ring. Complete the data narrative by adding titles and descriptive text to the three circular badges on the right side. All colors, percentages, and text are fully customizable to match your presentation needs.
-
Recommended For
Executives, marketing managers, strategy planners, and sales leaders presenting market analysis, competitive positioning, product differentiation, or customer satisfaction survey results. Particularly effective for executive briefings and strategic presentations requiring simultaneous comparison of three key performance indicators.
-
Slide Structure
Two-slide template with light and dark background options for flexible presentation environments. Each slide features a three-segment donut chart on the left (with percentage labels), complemented by three circular badges and text areas on the right. The 16:9 widescreen format ensures compatibility with modern presentation systems.
Related Products
-

Stock Price Rise Analysis Donut Graph – Market Growth and Opportunities
#Market and Competitor Analysis #Diagram #Graph
-

Key Competitive Factors in Market Analysis – First Step Toward Competitive Advantage
#Market and Competitor Analysis #Diagram #Graph
-

Visual Insights on Education Analysis PowerPoint
#Market and Competitor Analysis #Diagram #Graph
-

Market Analysis and Competitive Advantage Graph – The Power of Data Visualization
#Market and Competitor Analysis #Graph #Market Analysis
