Analysis and Graphs in Future Prediction – Market Strategy and Profitability
RJ0600091_10
- Last Update 07/15/2025
- File Size 0.1MB
- # of Slides 2
- File Format PPTX
- Slide Ratio 16:9
- Color
Keywords
- #Content-Based Slides
- #Design-Based Slides
- #Business Strategy
- #Market and Competitor Analysis
- #Diagram
- #Graph
- #Financial Outlook & Expected Impact
- #Future Outlook
- #Table
- #Column
- #Standard Table
- #Column Chart
- #16:9
- #vertical bar chart PowerPoint
- #bar graph presentation slide
- #market analysis chart
- #profitability analysis template
- #data visualization PPT
- #comparison chart slide
About the Product
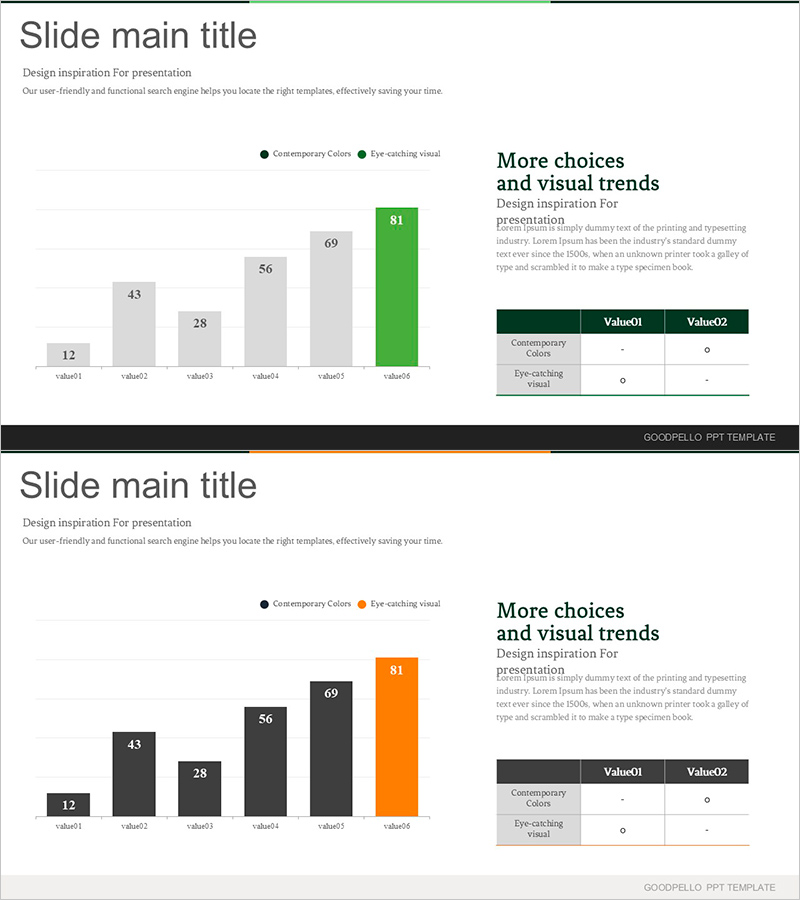
A vertical bar chart PowerPoint slide designed for market strategy and profitability analysis with six data points. This presentation slide visualizes numerical data ranging from 12 to 81 alongside a comparison table to clearly express future forecasts and business performance. The green accent color highlights key metrics, making it ideal for business presentations, market analysis reports, and performance comparisons across project phases. The 16:9 widescreen format with 2-slide composition integrates seamlessly into professional business decks.
Usage Points
-
Main Usage
Visualize numerical data through vertical bar charts to present market analysis, business performance comparisons, and revenue forecasts. The six-item comparison enables clear presentation of business phase performance and market share changes to support data-driven decision-making.
-
How to Use
Insert into business plans, investor pitch decks, quarterly performance reports, and market analysis presentations where numerical comparisons are essential. Edit the chart values and legend with your data, then populate the comparison table with additional information to create a polished presentation.
-
Recommended For
Executives, finance professionals, marketing strategists, and business development managers presenting data-driven analysis to stakeholders and investors. Particularly effective for quarterly performance reviews, market size trends, and revenue trajectory reports.
-
Slide Structure
Slide 1: Title area + 6-step vertical bar chart (values 12, 28, 43, 56, 69, 81) + legend (Contemporary Colors, Eye-catching visual) + comparison table (Value01, Value02 columns). Slide 2: Identical layout with bar colors changed to black and orange for color variation. 16:9 widescreen format, PPTX file.
Related Products
-

Denim PPT Vertical Bar Graph Analysis – Market and Competitor Analysis
#Business Strategy #Market and Competitor Analysis #Graph
-

Orange & Green Future Outlook Bar Graph
#Business Strategy #Market and Competitor Analysis #Graph
-

Blue Red Analysis Chart – New Insights into Market Analysis
#Market and Competitor Analysis #Diagram #Graph
-

Donation Participation Rate Graph – Business Strategy and Future Outlook
#Business Strategy #Market and Competitor Analysis #Graph
