Travel Competitor Analysis Vertical Bar Graph – Business Strategy
RJ0600030_12
- Last Update 06/28/2025
- File Size 1.6MB
- # of Slides 2
- File Format PPTX
- Slide Ratio 16:9
- Color
Keywords
- #Content-Based Slides
- #Design-Based Slides
- #Business Strategy
- #Graph
- #Financial Outlook & Expected Impact
- #Achievements
- #Column
- #Column Chart
- #16:9
- #travel competitor analysis PowerPoint
- #vertical bar chart slide
- #travel industry comparison
- #competitive analysis chart
- #business strategy graph PowerPoint
About the Product
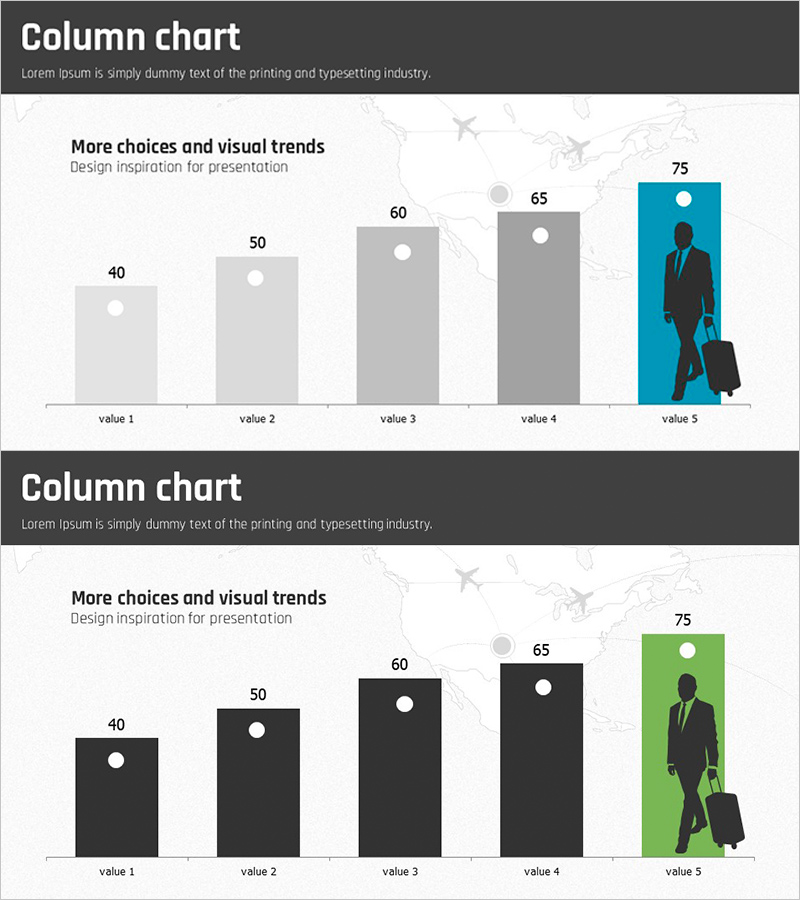
A vertical bar chart PowerPoint slide designed for travel industry competitive analysis. This slide enables clear comparison of five data points with numerical values displayed above each column. The design uses light gray, dark gray, and teal color schemes to visually distinguish key metrics, with a world map background reinforcing global business strategy context. Each bar features a white data point indicator for precise value communication. Ideal for executive presentations, investor pitches, and strategic planning sessions where competitive positioning needs clear visualization.
Usage Points
-
Main Usage
Visualize competitive positioning in the travel industry by comparing five critical metrics—such as revenue, customer base, market share, or service coverage—across competitors. Provides objective data representation for executive reports, investor presentations, and strategic planning meetings to establish clear competitive context.
-
How to Use
Replace default values (40, 50, 60, 65, 75) with actual competitive data. Maintain teal color for your company's metric to draw visual focus. Customize title and legend to match presentation context. The world map background emphasizes global market scope and international business strategy.
-
Recommended For
Travel agencies, airlines, hotel chains, and tourism platforms conducting competitive analysis. Recommended for executives, marketing teams, and strategy departments presenting competitive findings. Suitable for business plans, quarterly performance reports, competitive analysis sections, and investor relations materials.
-
Slide Structure
Two-slide set. First slide features five light gray columns (values 40, 50, 60, 65, 75) with white data point circles. Second slide uses dark gray, medium gray, and teal columns for emphasis comparison. World map background and business professional silhouette reinforce global business context across both slides.
Related Products
-

Flower Wide PPT Vertical Bar Graph – Performance and Expectations
#Business Strategy #Graph #Financial Outlook & Expected Impact
-

Vertical Bar Chart for Achieving Goals – Growth and Fulfillment
#Business Strategy #Graph #Financial Outlook & Expected Impact
-

Mountain Climbing Goals Market Strategy Vertical Bar Chart
#Business Strategy #Diagram #Graph
-

Growth Highlight Bar Graph – Revenue Outlook and Expectations
#Business Strategy #Graph #Financial Outlook & Expected Impact
