Network Development Budget and Profit and Loss Statement – Financial Planning Visualization
RJ0400005_10
- Last Update 05/18/2025
- File Size 0.2MB
- # of Slides 2
- File Format PPTX
- Slide Ratio 16:9
- Color
Keywords
About the Product
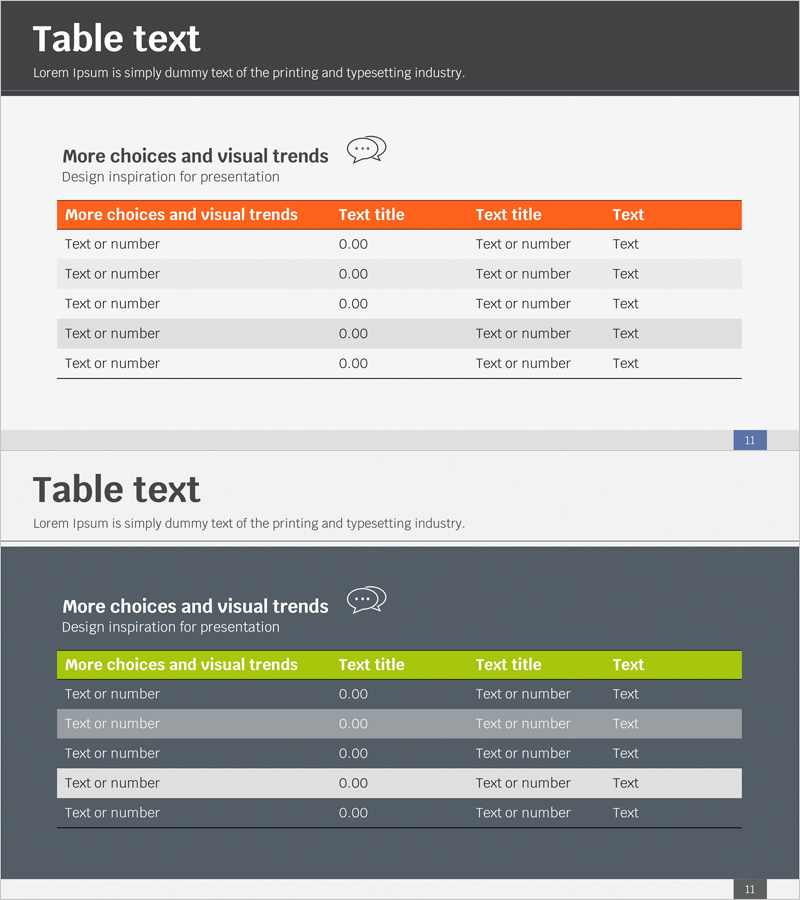
A 2-slide PowerPoint presentation set visualizing network development budget and profit-and-loss statement data. Features an orange header row and gray-striped data rows that clearly organize financial information in a structured table format. The 16:9 widescreen PPTX design is fully editable and ready to use in corporate financial reports, investor presentations, and business planning meetings. Effectively communicate budget allocations, expense categories, and financial performance with professional table layouts.
Usage Points
-
Main Usage
Present corporate financial data with clarity and precision using structured table layouts. These slides enable you to communicate budget breakdowns, expense categories, and P&L metrics to investors, executives, and stakeholders in a professional and organized manner.
-
How to Use
Use in business plans, investor presentations (IR), quarterly financial reports, budget approval meetings, and financial performance reviews. Replace placeholder text and numbers with your actual financial data, add or remove rows as needed, and adjust colors to match your corporate branding.
-
Recommended For
CFOs, financial managers, executives, business development professionals, and investor relations specialists presenting financial performance and budget forecasts. Ideal for internal financial reviews, board meetings, and external investor pitches requiring clear financial data presentation.
-
Slide Structure
2-slide set with each slide containing an orange header row and 5 data rows. First column displays item names; subsequent columns show numerical values and descriptions. Alternating gray and white row backgrounds enhance readability and data organization.
Related Products
-

Slide Template Presenting Text and Numbers – Communication and Efficiency
#Financial Plans and Performance #Diagram #Income Statement
-

Financial Performance Analysis Table Slide – Data Visualization for Growth
#Financial Plans and Performance #Diagram #Income Statement
-

Learning Illustrations and Table Charts – Visualizing Financial Performance
#Financial Plans and Performance #Diagram #Income Statement
-

Orange Green Profit and Loss Chart – Visualizing Revenue and Profit
#Financial Plans and Performance #Diagram #Graph
