Cyber Security Business Profit and Loss Statement
RJ0400069_12
- Last Update 06/06/2025
- File Size 0.2MB
- # of Slides 2
- File Format PPTX
- Slide Ratio 16:9
- Color
Keywords
- #Content-Based Slides
- #Design-Based Slides
- #Financial Plans and Performance
- #Diagram
- #Income Statement
- #Sales and Revenue
- #Table
- #Standard Table
- #16:9
- #table PowerPoint slide
- #profit and loss statement template
- #financial data table
- #cyber security business plan
- #revenue tracking slide
- #corporate financial report
- #data presentation PPT
- #how to create financial table in PowerPoint
About the Product
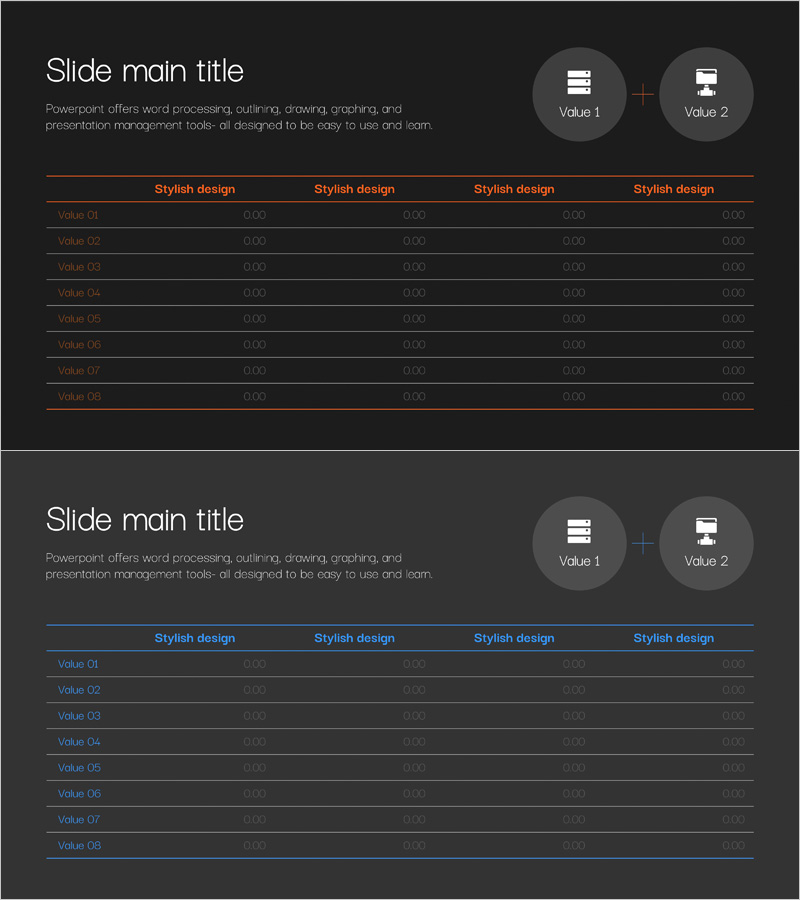
An 8-row by 4-column table PowerPoint slide designed to present financial data for cyber security business operations. The slide features a dark background with an orange header line and gray text, creating a professional layout for profit and loss statements, revenue tracking, and cost analysis. Each row is labeled Value 01 through Value 08, with four columns for numerical data entry. This template is ideal for corporate financial reports, business planning presentations, and performance analysis meetings. The 2-slide set allows you to compare multiple financial datasets side by side, making it easy to present quarterly results, departmental revenue, and expense breakdowns in a clear, organized manner.
Usage Points
-
Main Usage
Present financial data for cyber security business operations, including profit and loss statements, revenue tracking, and cost analysis. The 8-item structure (Value 01–08) with 4 columns allows you to display quarterly results, departmental revenue, expense categories, and other financial metrics in a clear, organized format.
-
How to Use
Use this template in executive financial reports, business planning presentations, quarterly performance reviews, and investor pitch meetings. Simply enter your numerical data into each cell to create a professional financial comparison. The 2-slide format enables you to present multiple time periods or data categories side by side for easy analysis and discussion.
-
Recommended For
CFOs, financial managers, business executives, business planners, consultants, and investment professionals. Particularly suitable for cyber security, IT services, finance, and manufacturing industries where quantitative financial analysis is critical. Ideal for business plans, quarterly reports, and investor relations materials.
-
Slide Structure
Both slides feature an identical 8-row by 4-column table layout. The header row is highlighted in orange with column titles, followed by 7 data rows labeled Value 01 through Value 08. Each cell is ready for numerical input. The dark background with gray text ensures data readability, while Value 1 and Value 2 icons at the top help distinguish data categories.
Related Products
-

Profit Analysis Graph – Visualizing Financial Performance
#Financial Plans and Performance #Diagram #Income Statement
-

Sales and Profit Table – Clear Visualization of Financial Planning
#Financial Plans and Performance #Diagram #Other
-

Sales and Profit Analysis Chart – An Effective Tool for Financial Performance
#Financial Plans and Performance #Diagram #Income Statement
-

Table of Contents for Business Success – Financial Planning and Performance
#Financial Plans and Performance #Diagram #Income Statement
