Analysis of Major Sales Segments – Visualizing Performance with Bar Chart Template
RB0800008-1_7
- Last Update 03/19/2025
- File Size 1.7MB
- # of Slides 2
- File Format PPTX
- Slide Ratio 4:3
- Color
Keywords
About the Product
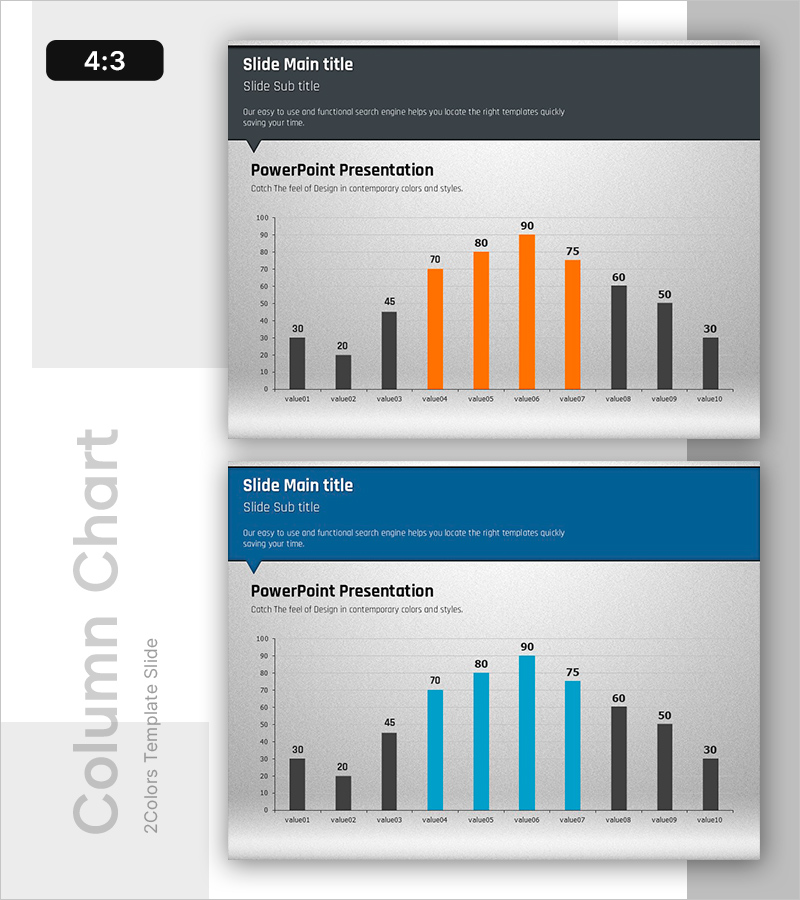
A vertical bar chart PowerPoint slide designed to compare sales performance across multiple segments. The template features a dual-series bar chart with dark gray and orange bars representing 10 data points, complete with Y-axis scale (0–100) and clear numerical labels on each bar. Provided in 4:3 aspect ratio with 2 slides, this presentation template is ready to use for business strategy presentations, quarterly performance reports, departmental target reviews, and sales analysis decks.
Usage Points
-
Main Usage
This slide visualizes numerical data such as quarterly sales, departmental performance, or product-line revenue using a vertical bar chart format. The 10-item comparison enables audiences to instantly grasp relative differences, rankings, and performance trends in a single view.
-
How to Use
Ideal for business strategy presentations, quarterly earnings reports, marketing performance reviews, and sales target achievement assessments. Configure dark gray bars as baseline targets and orange bars as actual results to display goal-versus-achievement metrics on one slide.
-
Recommended For
Finance teams presenting quarterly results, sales departments reviewing target achievement, executive briefings, and investor presentation materials. Particularly effective for business plans, reports, and proposals where numerical comparison is critical to establishing data credibility.
-
Slide Structure
Two-slide set featuring dual-series bar charts. Slide 1 displays dark gray and orange bars; Slide 2 shows dark gray and blue bars. Each slide contains 10 data points (value01–value10), Y-axis scale (0–100), numerical labels above bars, and is formatted in 4:3 aspect ratio.
Related Products
-

Market Analysis Vertical Bar Graph
#Business Strategy #Market and Competitor Analysis #Graph
-

Travel Competitor Analysis Vertical Bar Graph – Business Strategy
#Business Strategy #Graph #Financial Outlook & Expected Impact
-

Performance Column Graph – Business Strategy and Competitor Analysis
#Business Strategy #Market and Competitor Analysis #Graph
-

Vertical Bar Chart for Achieving Goals – Growth and Fulfillment
#Business Strategy #Graph #Financial Outlook & Expected Impact
