Graphical Analysis of Drug Component Responses – Innovative Data Visualization
RB0400015_5
- Last Update 03/12/2025
- File Size 3MB
- # of Slides 2
- File Format PPTX
- Slide Ratio 4:3
- Color
Keywords
- #Content-Based Slides
- #Design-Based Slides
- #Business Strategy
- #Technical Approach
- #Graph
- #Achievements
- #Research and Development
- #Innovative Technologies and Future Plans
- #Column
- #Column Chart
- #4:3
- #bar chart PowerPoint slide
- #data comparison presentation
- #medical analysis chart
- #pharmaceutical data visualization
- #5-item comparison graph
About the Product
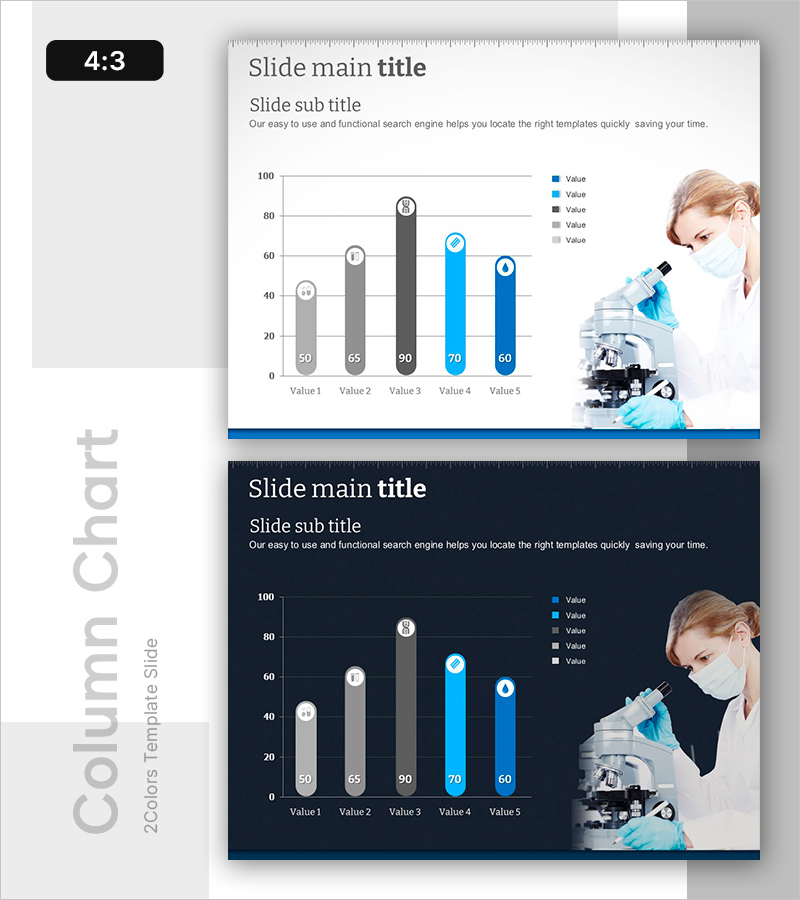
A 5-item comparison bar chart PowerPoint slide designed for pharmaceutical and medical data analysis. Two versions provided: light background and dark background for flexible presentation needs. Gray and blue bar colors distinguish five data series, with numerical labels displayed above each bar for precise data comparison. Ideal for research presentations, clinical trial results, pharmaceutical reports, and medical institution performance reviews. Ready-to-use slide template for healthcare, pharmaceutical, and research sectors.
Usage Points
-
Main Usage
Visualize and compare five data items using a vertical bar chart format. Ideal for displaying pharmaceutical component responses, clinical trial results, medical metrics, and research data. The chart structure enables quick visual comparison of numerical values across multiple categories in healthcare and scientific presentations.
-
How to Use
Replace the default Value 1-5 labels and numerical data (50, 65, 90, 70, 60) with your own dataset. Choose the light background version for projector presentations or the dark background version for online meetings and print materials. Bar colors and legend can be customized to match your brand or presentation theme.
-
Recommended For
Pharmaceutical companies presenting clinical trial results, research institutions analyzing experimental data, hospitals and medical centers reporting performance metrics, pharmaceutical sales presentations, medical academic conferences, and healthcare organizations requiring quantitative data visualization. Suitable for any medical or scientific field requiring comparative data analysis.
-
Slide Structure
Two-slide set. Slide 1 features light background (light gray and white) with 5-bar chart; Slide 2 displays dark background (navy and black) with identical chart structure. Each slide includes title and subtitle areas, legend with 5 color-coded values, five vertical bars (heights ranging 50-90), numerical labels above bars, and medical professional image (scientist with microscope) on the right side.
Related Products
-

Square Frame Template Column Chart – Business Performance Report
#Business Strategy #Financial Plans and Performance #Graph
-

Rainbow Paper Presentation Template Column Chart1 – Visualizing Market Trends
#Business Strategy #Market and Competitor Analysis #Graph
-

Renewable Energy Bar Graph – Performance and Strategy
#Business Strategy #Financial Plans and Performance #Graph
-

Two Idea Strategies – Innovative Future Planning
#Technical Approach #Diagram #Research and Development
