Business Trends Chart - Suitable for Strategic Planning
RB0800008-1_28
- Last Update 03/19/2025
- File Size 1.7MB
- # of Slides 2
- File Format PPTX
- Slide Ratio 4:3
- Color
Keywords
About the Product
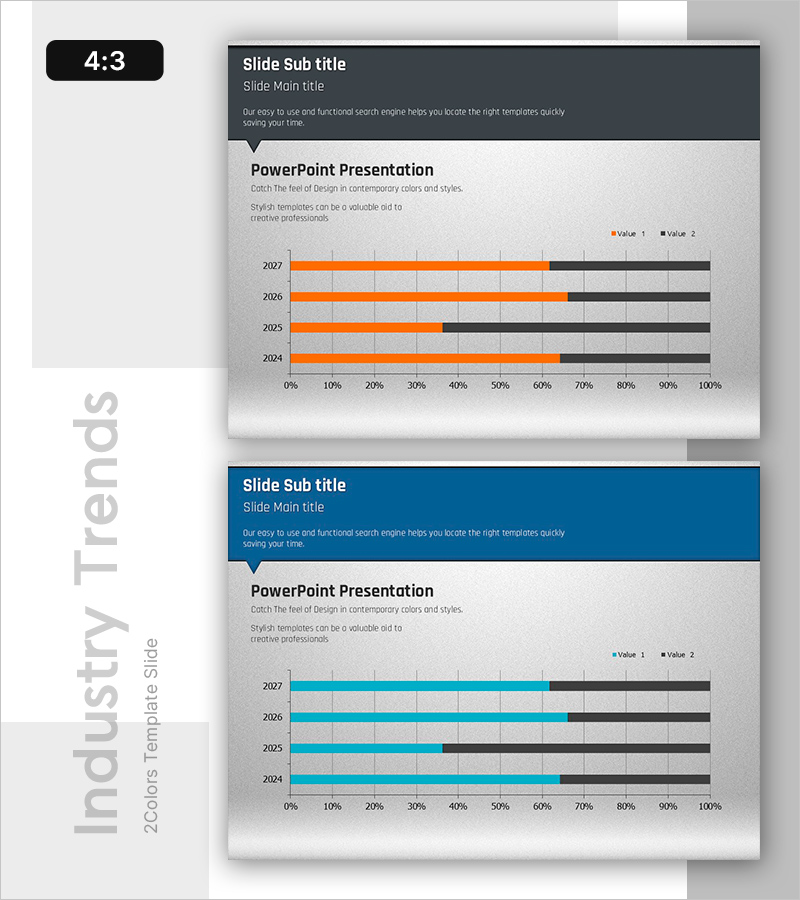
A horizontal bar chart PowerPoint slide that visualizes annual business trends across four years (2024–2027) with dual-value comparison. This presentation template displays two data series (Value 1 and Value 2) side-by-side for each year, making it ideal for strategic planning and performance analysis. The orange and gray color scheme clearly differentiates data categories, while the 0%–100% horizontal axis with gridlines ensures accurate data readability. Ready to edit and integrate into business reports, pitch decks, proposals, and strategic presentations.
Usage Points
-
Main Usage
Displays year-over-year performance metrics and KPI trends across two comparable data series, enabling clear communication of business growth, market shifts, or operational changes. Ideal for executive briefings, board meetings, investor presentations, and strategic planning sessions.
-
How to Use
Replace the title and subtitle with your analysis topic. Update the legend labels (Value 1, Value 2) and numerical values with actual data. Bar lengths auto-scale; customize colors, fonts, and axis ranges to match corporate branding guidelines.
-
Recommended For
Finance, planning, marketing, and sales teams presenting quarterly or annual performance reviews. Suitable for business plans, annual reports, marketing strategies, consulting proposals, investor pitch decks, and data-driven decision-making documents.
-
Slide Structure
Two-slide set. First slide features a dark gray header section (title and subtitle) with light gray content area and a 4-row horizontal bar chart (2027, 2026, 2025, 2024) with dual orange and gray data series. Second slide offers a dark blue header variant for visual variety and flexible design options.
Related Products
-

Stack Bar Chart Map for Market and Competitor Analysis
#Market and Competitor Analysis #Marketing Plan and Strategy #Graph
-

Triangular Pattern Bar Chart Template – Market Insight Analysis
#Business Strategy #Market and Competitor Analysis #Graph
-

Ship Logistics Equipment Status Analysis – Facility and Market Overview
#Business Introduction #Market and Competitor Analysis #Graph
-

Gender Ratio Bar Graph – Market and Competitor Analysis
#Market and Competitor Analysis #Graph #Competitor Analysis
