Market Share Analysis with Donut Diagram – Easy Data Visualization
RJ0800049_6
- Last Update 08/14/2025
- File Size 0.7MB
- # of Slides 2
- File Format PPTX
- Slide Ratio 16:9
- Color
Keywords
- #Content-Based Slides
- #Design-Based Slides
- #Market and Competitor Analysis
- #Diagram
- #Graph
- #Market Share
- #Cluster
- #Circles
- #Closed Cluster Diagram
- #Doughnut Chart
- #16:9
- #donut chart PowerPoint slide
- #pie chart template download
- #market share analysis PPT
- #data visualization PowerPoint
- #donut graph presentation template
About the Product
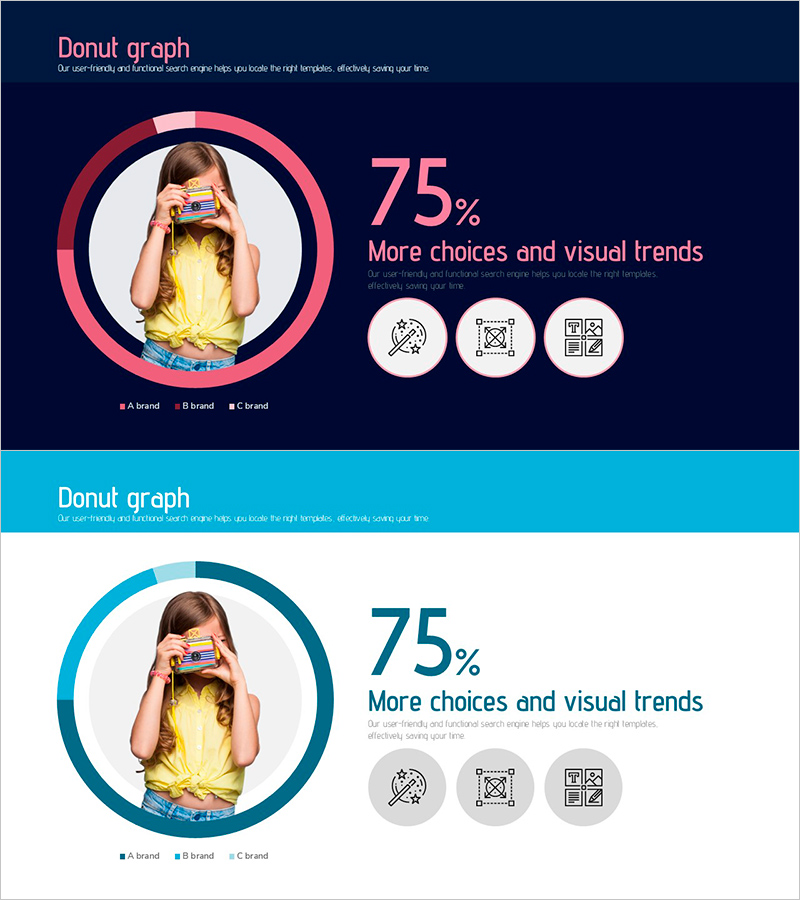
A professional donut chart PowerPoint slide designed to visualize market share, brand comparison, and sales composition with clarity and impact. Features two color versions—dark navy with coral-pink accents and bright turquoise—allowing flexible design choices for different presentation contexts. The center circular area accommodates product photos or brand logos, while the right side displays percentage values and legend labels. Includes 3 data segments with supporting icons and clean typography. Fully editable in 16:9 widescreen format across 2 slides, ready for business presentations, marketing analysis, and sales reports.
Usage Points
-
Main Usage
Effectively communicate market share distribution, brand-wise sales ratios, customer composition percentages, and product category breakdowns. The center circular zone accommodates product imagery or brand logos, amplifying visual engagement and message retention during executive presentations.
-
How to Use
Deploy in marketing analysis presentations, quarterly sales reports, customer segmentation workshops, and brand positioning pitches. Simply update the donut chart segments with your data percentages, replace the center photo, and customize legend labels to match your brand or product categories.
-
Recommended For
Marketing managers, sales directors, business analysts, brand strategists, and C-suite presenters who need to communicate quantitative insights compellingly. Ideal for B2B sales decks, board meetings, investor updates, and competitive analysis sessions.
-
Slide Structure
Slide 1: Dark navy background with coral-pink donut chart (3 segments) + center circular photo zone + right-aligned 75% metric + legend (A brand, B brand, C brand) + 3 supporting icons / Slide 2: Identical layout in turquoise variant. Both slides 16:9 widescreen, 3 data nodes, 4 editable zones (percentage, legend, photo, title).
Related Products
-

Application Development Status Visualized with Doughnut Diagram
#Product/Service Introduction #Market and Competitor Analysis #Diagram
-

Red Purple Highlight Donut Chart - Market Share Analysis
#Business Introduction #Market and Competitor Analysis #Diagram
-

Mobile App Market Share Analysis Graph
#Product/Service Introduction #Market and Competitor Analysis #Diagram
-

Market Share by Instrument Visualization – Donut Chart for Market Analysis
#Market and Competitor Analysis #Diagram #Graph
