Blue Line Wide Template – Vertical Bar Chart Analysis
RJ0200066_24
- Last Update 04/18/2025
- File Size 0.2MB
- # of Slides 2
- File Format PPTX
- Slide Ratio 16:9
- Color
Keywords
About the Product
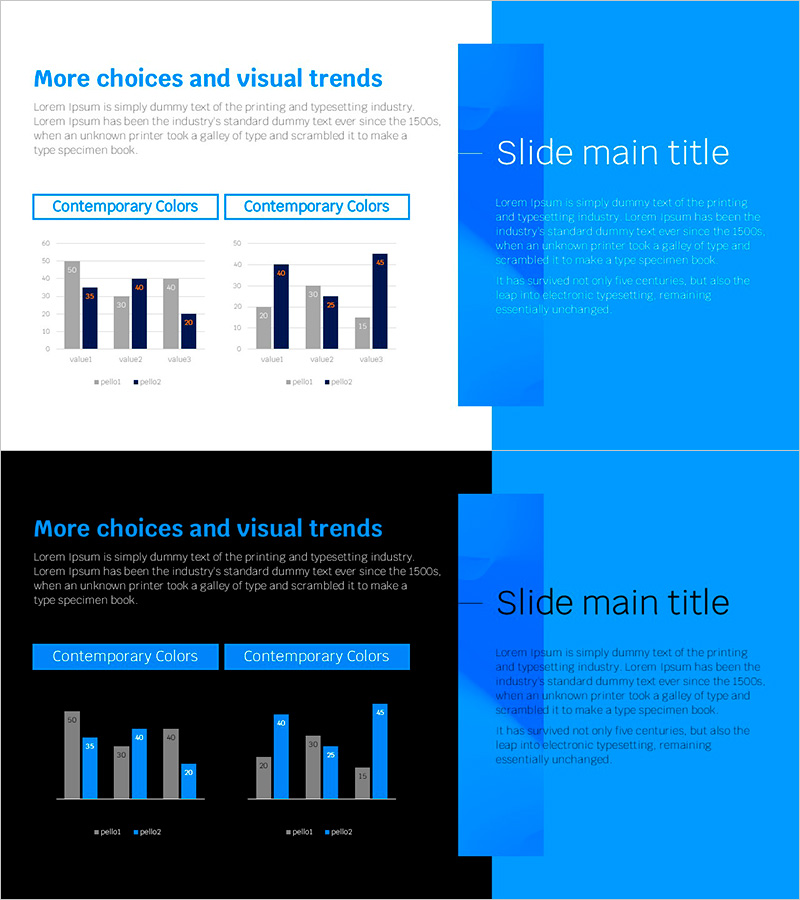
A vertical bar chart PowerPoint slide optimized for market analysis and competitive comparison. The design features a bright blue background with dark blue and gray bar series for clear numerical comparison. Each slide layout includes a title and description area on the left, with two independent bar chart graphs positioned on the right for enhanced information delivery. This 16:9 widescreen 2-slide template is ready to use in presentations, reports, and business proposals.
Usage Points
-
Main Usage
Designed to visually represent numerical data comparisons across items and highlight differences between series. Ideal for comparing market size, sales volume, customer satisfaction, performance metrics, and other multi-category data simultaneously.
-
How to Use
Enter your analysis title and key insights in the left text area, then input actual data into the right-side graphs. The bar heights and colors intuitively convey numerical differences, making it immediately applicable for executive briefings, investor pitches, and strategic meetings.
-
Recommended For
Recommended for marketing, sales, and strategy professionals analyzing market conditions and competitive landscape; finance teams comparing revenue, costs, and profitability; and planning teams reporting business performance and goal achievement.
-
Slide Structure
2-slide set. Each slide contains 2 independent vertical bar graphs with 3-4 items (value1, value2, value3) and 2 series (series1, series2) per graph. Bright blue background with dark blue, gray, and white text creates strong visual contrast.
Related Products
-

Pill Market Analysis Vertical Bar Graph – Clear Visualization of Market Status
#Market and Competitor Analysis #Graph #Competitor Analysis
-

Bar Graph for Market Analysis – Emphasizing Competitiveness
#Market and Competitor Analysis #Graph #Competitor Analysis
-

Grouped Bar Chart for Learning Categories
#Market and Competitor Analysis #Graph #Competitor Analysis
-

Curve Chart of Architectural Topics
#Market and Competitor Analysis #Graph #Competitor Analysis
