Global Goal Achievement Rate Visualization – Insights Through Market Analysis
RJ0300023_30
- Last Update 04/24/2025
- File Size 0.7MB
- # of Slides 2
- File Format PPTX
- Slide Ratio 16:9
- Color
Keywords
- #Content-Based Slides
- #Design-Based Slides
- #Company Introduction
- #Market and Competitor Analysis
- #Graph
- #Other
- #Global Network
- #Target Market
- #Circles
- #Pie Chart
- #Map
- #16:9
- #world map PowerPoint slide
- #regional data visualization
- #global market analysis presentation
- #geographic infographic
- #international trade chart
- #pie chart world map
About the Product
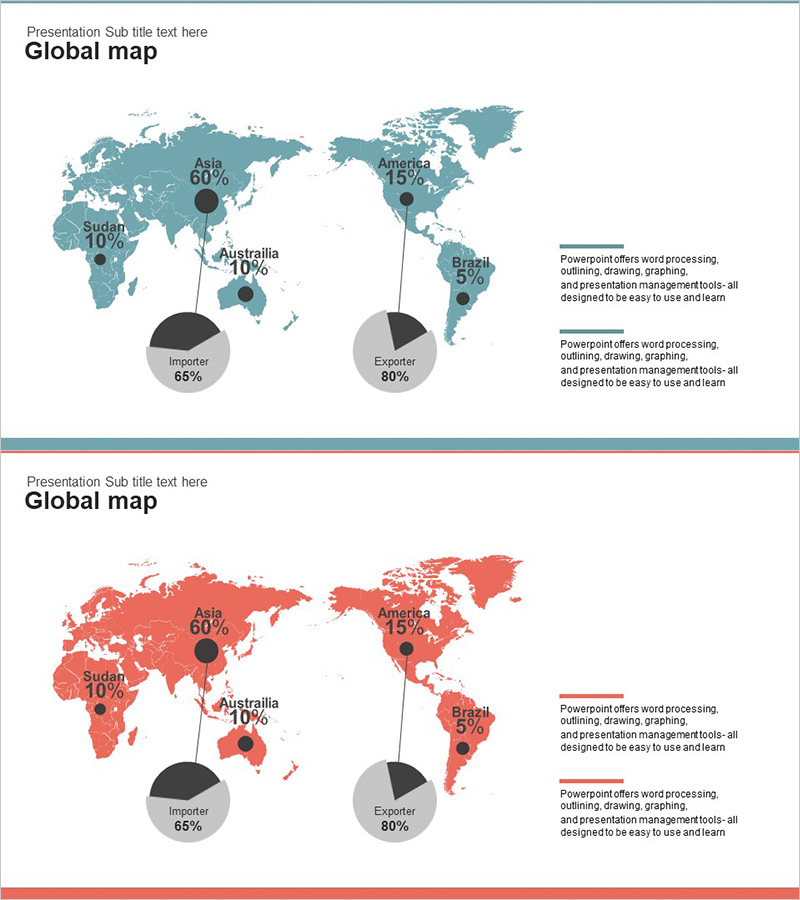
A comprehensive world map PowerPoint slide set designed for global market analysis and regional performance visualization. This 2-slide presentation features teal and coral color variants, each displaying a world map with key regions (Asia, America, Sudan, Australia, Brazil) marked with percentage data and corresponding pie charts showing import-export ratios. Perfect for international business presentations, market share analysis, and cross-border trade reports. The slides are fully editable in 16:9 widescreen PPTX format, compatible with all PowerPoint versions, allowing you to customize regional data, percentages, and chart values to match your specific business metrics.
Usage Points
-
Main Usage
Visualize global market distribution, regional performance metrics, and international trade volumes directly on a world map background. The slides integrate geographic markers with pie charts to compare import-export ratios, making complex global data immediately comprehensible for strategic business presentations and market analysis reports.
-
How to Use
Replace region names and percentage values with your actual data. Use the teal version for presentations emphasizing stability and trust, or the coral version for growth-focused narratives. Modify pie chart percentages to reflect current import-export figures. Add or remove regional markers and connector lines to highlight specific markets or trading partners relevant to your presentation.
-
Recommended For
International business strategy presentations, global market analysis reports, regional sales and export-import performance reviews, cross-border partnership proposals, and overseas expansion plans. Ideal for executives, marketing teams, sales departments, and strategic planning units communicating global performance metrics to stakeholders.
-
Slide Structure
Two-slide set with teal and coral color schemes. Each slide features a world map background with five marked regions (Asia 60%, America 15%, Sudan 10%, Australia 10%, Brazil 5%) connected by lines to data points. Bottom section displays dual pie charts for import (65%) and export (80%) ratios. Right-side text area accommodates additional descriptive content and annotations.
Related Products
-

Target Country Analysis Map – Insights into Global Markets
#Company Introduction #Market and Competitor Analysis #Graph
-

Layout Design Presentation Template with Europe Map
#Company Introduction #Market and Competitor Analysis #Graph
-

Country-by-Country Bar Chart Analysis – Market Trend Insights
#Company Introduction #Market and Competitor Analysis #Graph
-

Global Target Country Map – Essential Tool for Market Analysis
#Company Introduction #Market and Competitor Analysis #Other
