Visualizing Financial Performance with Standard Table Slide
RB0800008-1_15
- Last Update 03/18/2025
- File Size 2.1MB
- # of Slides 2
- File Format PPTX
- Slide Ratio 4:3
- Color
Keywords
- #Content-Based Slides
- #Design-Based Slides
- #Financial Plans and Performance
- #Diagram
- #Balance Sheet
- #Key Financial Indicators
- #Table
- #Standard Table
- #4:3
- #table PowerPoint slide
- #financial data table
- #4-column table template
- #comparison analysis slide
- #financial performance visualization
- #data table slide design
About the Product
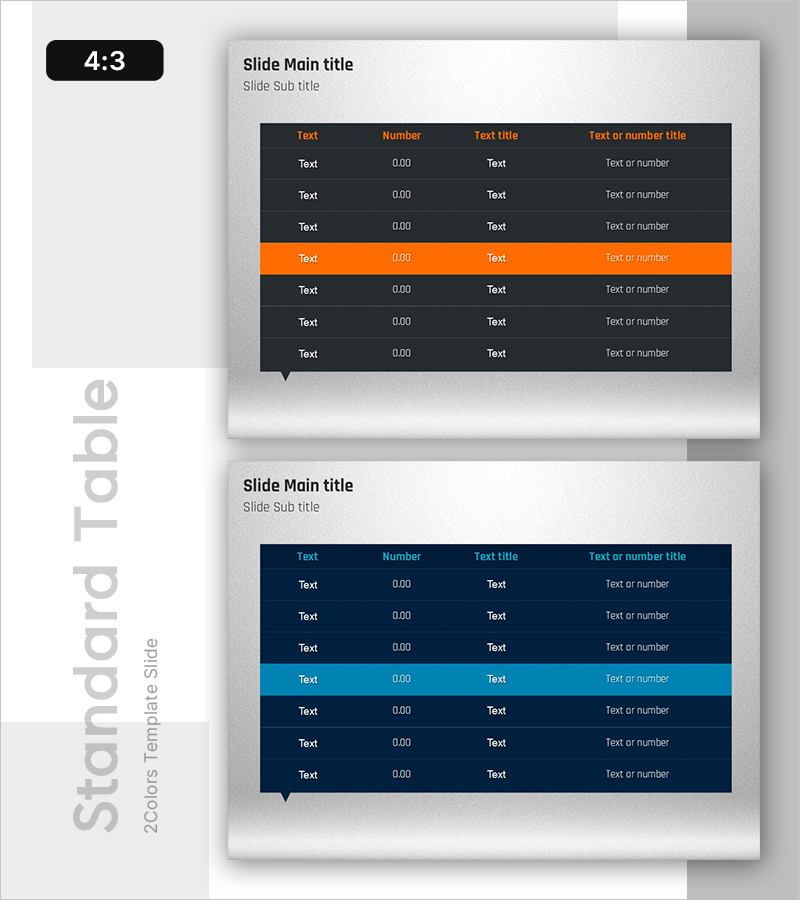
A four-column table slide template designed to compare and analyze financial performance and key metrics in PowerPoint presentations. The dark background with orange and cyan accent rows highlights critical data points, while text and numerical columns are systematically aligned for clarity. This 2-slide set enables you to organize and present diverse financial information such as revenue, expenses, profit margins, and growth rates in structured table format. Available in 4:3 PPTX format for seamless integration into existing presentations, with fully editable colors, headers, and data fields.
Usage Points
-
Main Usage
Present financial reports, business performance updates, and investor presentations by displaying key metrics such as revenue, expenses, profit margins, and growth rates in a clear, comparative table format to support decision-making.
-
How to Use
Input your company's financial data (quarterly, annual, or departmental figures) into the table cells. Use the orange and cyan accent rows to emphasize critical metrics. Add or remove columns and rows to display only the relevant financial indicators needed for your presentation.
-
Recommended For
CFOs, finance managers, and executives presenting financial results to stakeholders, investors, and boards. Ideal for quarterly earnings reports, annual business reviews, investor pitch decks, and financial performance briefings.
-
Slide Structure
Two-slide set, each featuring a 4-column table with 7-8 rows. First slide uses dark background with orange accent row; second slide uses dark background with cyan accent row. Columns accommodate text headers, numerical values, and descriptive titles for flexible data organization.
Related Products
-

Organize Financial Plans with Abstract Pattern Template
#Financial Plans and Performance #Diagram #Balance Sheet
-

Modern Blue Table Chart Presentation Template
#Financial Plans and Performance #Diagram #Balance Sheet
-

Sleek Diagram and Chart Design
#Financial Plans and Performance #Diagram #Balance Sheet
-

Green Brown Statistics Table – Financial Performance Analysis
#Financial Plans and Performance #Diagram #Balance Sheet
