Origami Line Chart Slide - Visualizing Business Performance
RB0800007_9
- Last Update 03/18/2025
- File Size 0.2MB
- # of Slides 2
- File Format PPTX
- Slide Ratio 4:3
- Color
Keywords
- #Content-Based Slides
- #Design-Based Slides
- #Business Strategy
- #Market and Competitor Analysis
- #Graph
- #Achievements
- #Market Status
- #Line
- #Line Chart
- #4:3
- #line chart PowerPoint slide
- #trend analysis graph
- #data visualization PPT
- #business performance chart
- #multi-series line graph PowerPoint template
About the Product
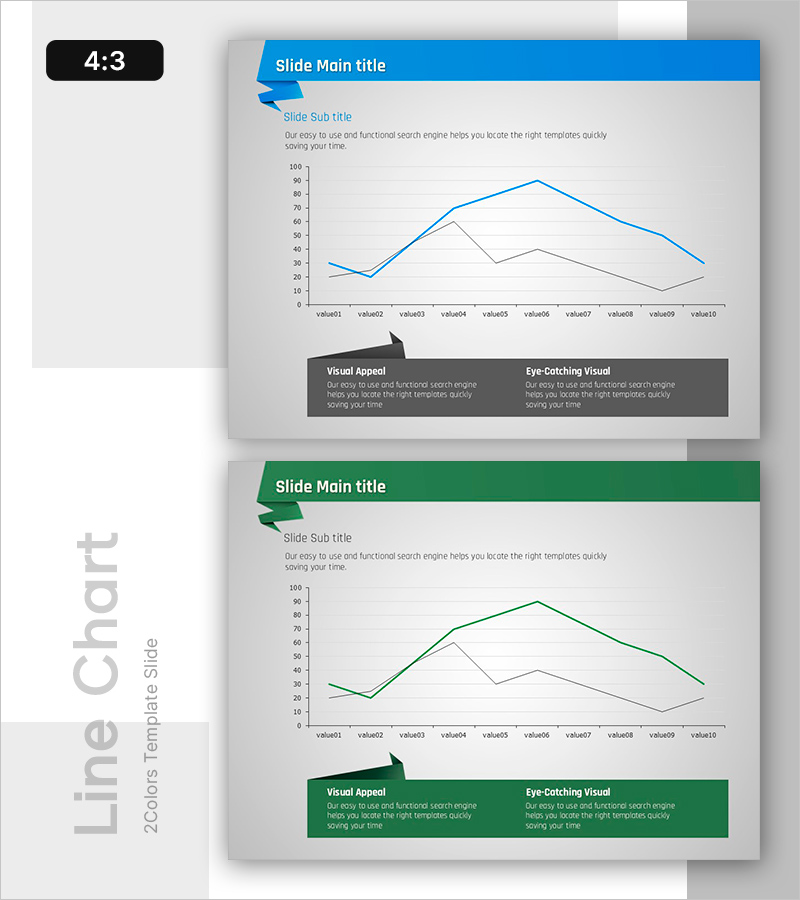
A line chart PowerPoint slide that visualizes data changes across two series with blue and gray line colors. This presentation slide effectively displays business performance, market analysis, and growth trends through 10 data points that clearly show patterns over time. The 4:3 aspect ratio template includes 2 slides: a title slide and a chart slide, ready for immediate use in reports and presentations. Easily customize data values, axis labels, and colors to match your specific analysis context.
Usage Points
-
Main Usage
Designed to compare and analyze changes in two or more data series over time. Ideal for presenting business performance trends, market share evolution, revenue growth rates, customer satisfaction metrics, and other quantitative data in a clear, visual line format that reveals patterns at a glance.
-
How to Use
Start by setting your analysis topic on the title slide, then replace the data values (value01 through value10) on the chart slide with your actual figures. Modify the legend and axis labels to fit your presentation context, and adjust colors as needed. All elements are fully editable in PowerPoint.
-
Recommended For
Executive reports, quarterly performance presentations, marketing analytics, financial reviews, and business planning sessions where historical trends support strategic decisions. Ideal for consultants, analysts, planners, and finance professionals presenting data-driven insights to stakeholders.
-
Slide Structure
Slide 1: Title slide with main title and subtitle areas / Slide 2: Line chart with blue line (primary series) and gray line (comparison series), 10 data points, Y-axis scale 0–100, two text sections at bottom (Visual Appeal and Eye-Catching Visual) for additional insights.
Related Products
-

Infographic Slide Visualizing App Market Sales Trends
#Business Strategy #Market and Competitor Analysis #Graph
-

Market Analysis Broken Line Graph – Visualizing Business Performance
#Business Strategy #Market and Competitor Analysis #Graph
-

Market Status Chart Analysis – Data-Driven Insights
#Business Strategy #Market and Competitor Analysis #Graph
-

Curve Graph of a Meal – Business Strategy
#Business Strategy #Market and Competitor Analysis #Graph
