Gender Analysis Chart – Ideal for Market & Customer Analysis
RJ0600082_25
- Last Update 07/12/2025
- File Size 0.3MB
- # of Slides 2
- File Format PPTX
- Slide Ratio 16:9
- Color
Keywords
- #Content-Based Slides
- #Design-Based Slides
- #Market and Competitor Analysis
- #Financial Plans and Performance
- #Graph
- #Other
- #Customer Analysis
- #Sales and Revenue
- #Column
- #Grouped Column
- #16:9
- #gender analysis chart
- #infographic PowerPoint slide
- #bar chart template
- #customer demographics
- #market analysis graph
About the Product
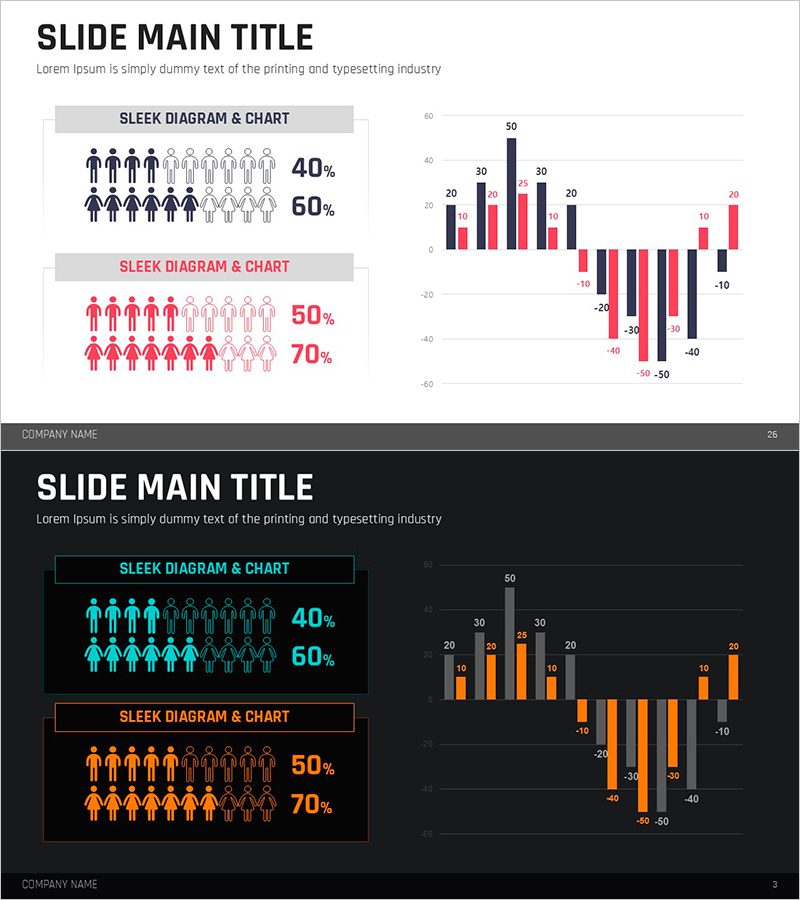
A 2-slide PowerPoint presentation designed to visualize gender-based demographic data. The first slide features male and female silhouette icons with percentage indicators to show customer composition intuitively, while the second slide displays a multi-series bar chart comparing numerical trends across multiple data points. Both light and dark background themes are included, making it ideal for market analysis, customer segmentation, and business performance presentations. Optimized for 16:9 widescreen format to fit modern presentation environments seamlessly.
Usage Points
-
Main Usage
Visualize customer demographics, market segmentation, and gender-based business insights. The infographic clearly shows composition ratios while the bar chart enables detailed numerical comparison and trend analysis to support data-driven decision-making.
-
How to Use
Use in marketing strategy presentations, customer analysis reports, and market research findings. Present customer composition ratios on the first slide, then explain detailed metrics and trends using the second slide's graph to build a compelling data narrative.
-
Recommended For
Marketing teams, sales departments, executives, business analysts, and market researchers. Ideal for customer segmentation by gender, product development strategy, and advertising targeting decisions requiring demographic data visualization.
-
Slide Structure
Slide 1: Two sets of male/female silhouette icons (10 each) with percentage labels (40%, 60%, 50%, 70%) / Slide 2: Multi-series bar chart with 5 categories, 3 data series, and mixed positive/negative values. Includes light theme (gray, pink, navy) and dark theme (cyan, orange) color options.
Related Products
-

Bundled Vertical Bar Graph Blue Green – Market and Customer Analysis
#Market and Competitor Analysis #Financial Plans and Performance #Graph
-

Comparative Chart of Male and Female Professionals
#Market and Competitor Analysis #Graph #Other
-

Gender Ratio Analysis Graph Chart – Data Visualization and Customer Insights
#Market and Competitor Analysis #Graph #Other
-

Coffee Consumption Survey by Gender – Visual Data Infographic
#Market and Competitor Analysis #Financial Plans and Performance #Diagram
