Financial Plans and Performance Presentation Template – Professional and Reliable Design
RJ0800006_20
- Last Update 03/18/2025
- File Size 0.4MB
- # of Slides 4
- File Format PPTX
- Slide Ratio 16:9
- Color
Keywords
- #Content-Based Slides
- #Design-Based Slides
- #Market and Competitor Analysis
- #Financial Plans and Performance
- #Graph
- #Customer Analysis
- #Market Share
- #Capital Requirements
- #Horizontal Bar
- #Segmented Horizontal Bar
- #16:9
- #horizontal bar chart PowerPoint
- #financial comparison slide
- #performance analysis presentation
- #budget vs actual chart
- #financial planning template
About the Product
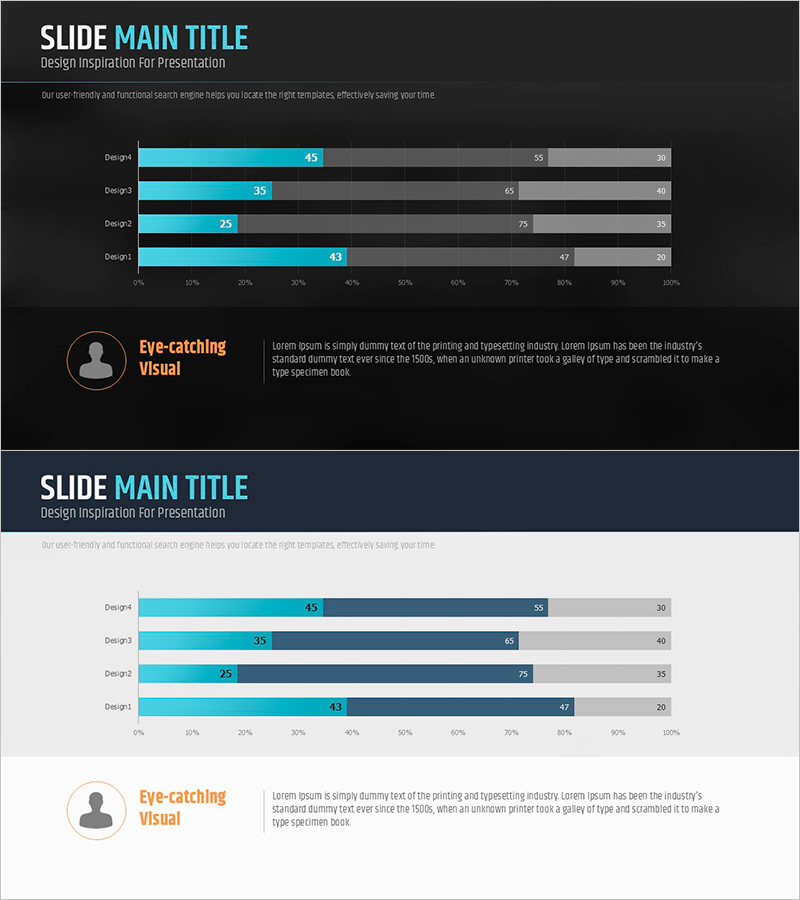
A horizontal bar chart PowerPoint slide for comparing financial plans and performance across four items. Designed with a dark gray background and dual-tone cyan and navy bars that clearly highlight numerical comparisons. Each item displays three data series (actual, target, variance) simultaneously, making it ideal for financial analysis, performance evaluation, budget-to-actual reviews, and business forecasting. The 16:9 widescreen format with 4 slides integrates seamlessly into presentation data sections for immediate use.
Usage Points
-
Main Usage
Visualize financial analysis, budget-to-actual comparisons, and performance evaluations through multi-series bar charts. The 4-item, 3-series structure enables simultaneous display of actual results, targets, and variances for data-driven decision-making.
-
How to Use
Use in financial reports, business performance presentations, and executive briefings to compare quarterly or annual financial metrics, departmental budget execution, and goal achievement rates. Bar length and color convey both magnitude and data series at a glance.
-
Recommended For
CFOs, finance managers, executives, and business unit leaders presenting financial performance. Also suitable for consultants delivering financial analysis to clients. Ideal for any business presentation requiring quantitative comparisons.
-
Slide Structure
Dark gray background with 4 rows (Design1–4). Each row contains 3 horizontal bars (cyan, navy, light gray) with numerical labels at bar ends. Legend and description text area positioned at bottom for context and interpretation.
Related Products
-

Horizontal Bar Charts for Customer Analysis – Summer Vacation Template
#Market and Competitor Analysis #Graph #Other
-

Customer Analysis Donut Chart - Visualizing Market Share
#Market and Competitor Analysis #Graph #Other
-

Visually Appealing Infographic Slide – Interesting Design
#Market and Competitor Analysis #Graph #Customer Analysis
-

Cover Slide for Numerical Analysis by Customer Insights
#Market and Competitor Analysis #Graph #Customer Analysis
