Business Future Outlook Granular Horizontal Bar Graph
RJ0600027_25
- Last Update 06/27/2025
- File Size 0.2MB
- # of Slides 2
- File Format PPTX
- Slide Ratio 16:9
- Color
Keywords
- #Content-Based Slides
- #Design-Based Slides
- #Market and Competitor Analysis
- #Graph
- #Market Share
- #Future Outlook
- #Horizontal Bar
- #Segmented Horizontal Bar
- #16:9
- #100% stacked bar chart PowerPoint
- #horizontal bar graph template
- #stacked bar chart slide
- #market share visualization
- #how to create stacked bar chart in PowerPoint
- #business trend PowerPoint slide template
About the Product
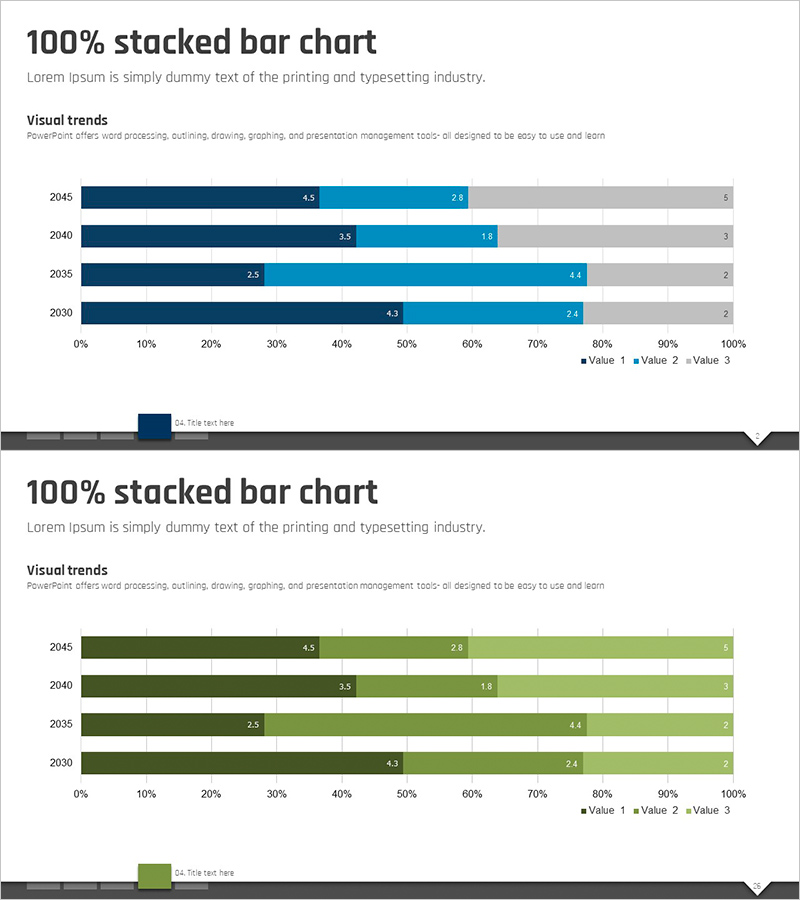
A 100% stacked horizontal bar chart PowerPoint slide designed to visualize business outlook and market share trends. This presentation template displays data across four years (2030–2045) divided into three series, with two color scheme options: navy blue, light blue, and gray tones, plus a green variant. Each bar represents 100% composition with proportional segments clearly labeled, making it ideal for market analysis reports, business planning presentations, and strategic forecasting slides.
Usage Points
-
Main Usage
Visualize business outlook, market share evolution, and year-over-year proportion changes using 100% stacked format. Each series segment shows relative contribution, enabling clear communication of market dynamics and strategic shifts in business planning and performance reports.
-
How to Use
Input data for four years (2030, 2035, 2040, 2045) across three series. Each bar automatically scales to 100% with proportional segments. Includes legend and value labels for presentation clarity. Easily customize colors to match corporate branding or presentation theme.
-
Recommended For
Ideal for executives, strategy teams, marketing departments, and finance teams presenting business plans, market analysis reports, quarterly and annual performance reviews. Effective for illustrating market share shifts, customer segment composition changes, and product portfolio evolution.
-
Slide Structure
Two-slide deck. Each slide contains four horizontal bars (one per year: 2030, 2035, 2040, 2045) with three stacked segments (Value 1, 2, 3) and corresponding legend. Includes 0–100% horizontal axis, year labels on vertical axis, and value labels within segments. Two design variants: navy/light blue/gray and green color schemes.
Related Products
-

Graph Ratio by Subject – Education Market Analysis
#Market and Competitor Analysis #Graph #Market Share
-

Simple Circle Template – Horizontal Segmentation Graph
#Market and Competitor Analysis #Graph #Market Status
-

National Trend Change Graph Visualization – Horizontal Bar Chart
#Market and Competitor Analysis #Graph #Other
-

Horizontal Bar Graph Segmentation Blue Yellow – Market Share Analysis
#Market and Competitor Analysis #Graph #Market Share
