Analysis by Pie Chart Item – Visualizing Market Share
RB0800004_13
- Last Update 03/17/2025
- File Size 3MB
- # of Slides 2
- File Format PPTX
- Slide Ratio 4:3
- Color
Keywords
- #Content-Based Slides
- #Design-Based Slides
- #Market and Competitor Analysis
- #Graph
- #Market Share
- #Market Analysis
- #Circles
- #Pie Chart
- #4:3
- #pie chart PowerPoint slide
- #circular graph template
- #market share analysis
- #data visualization slide
- #percentage comparison chart
- #pie chart design
- #3-segment graph PowerPoint
About the Product
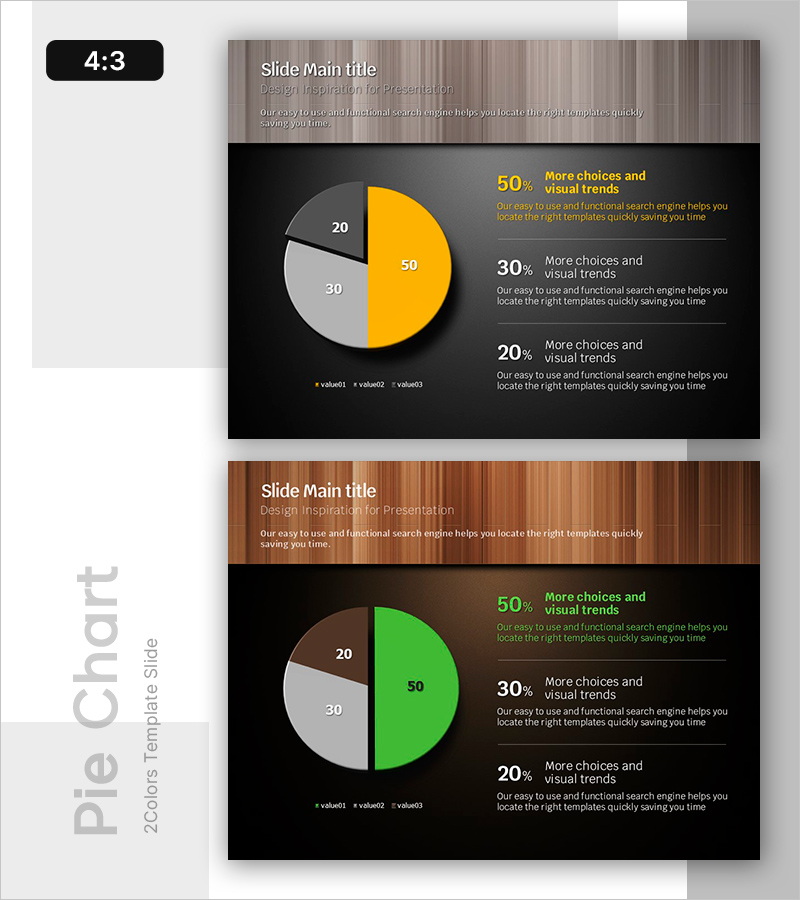
A three-segment pie chart PowerPoint slide designed to visualize market share and sales distribution at a glance. The circular graph uses yellow, gray, and black color segments to represent data proportions intuitively, while the right-side text area displays numerical values and descriptions for each category. The dark background and minimalist layout enhance credibility for business presentations, making it immediately applicable to reports, marketing analysis, and executive presentations. The 2-slide set includes alternative color versions (yellow and green) to match your document's tone and branding requirements.
Usage Points
-
Main Usage
Visualizes three-item numerical comparisons such as market share, sales composition, and distribution percentages using a pie chart format. The proportional size of each segment communicates ratios intuitively, while accompanying text provides specific values and interpretation to enhance audience comprehension.
-
How to Use
Apply this slide in marketing analysis, business reports, and executive presentations when explaining competitive market share, product sales composition, or customer demographic distribution. The high-contrast dark background design displays clearly in projector environments and is suitable for printed materials as well.
-
Recommended For
Recommended for marketing professionals, executives, analysts, and consultants who need to communicate quantitative data effectively. Ideal for quarterly performance reports, new product market analysis, customer segmentation strategy presentations, and data-driven business decision-making materials.
-
Slide Structure
2-slide set featuring two color versions: yellow and green. Each slide layout positions a 3-segment pie chart on the left (with sample data: 50%, 30%, 20%), and a text area on the right containing category names, numerical values, and descriptions. Legend and data labels are clearly displayed for easy reference.
Related Products
-

Detailed Regional Analysis Chart – Market Share Visualization
#Market and Competitor Analysis #Graph #Market Share
-

Design Pattern Template Pie Chart – Market Share Analysis
#Market and Competitor Analysis #Graph #Market Share
-

App Payment Service Market Analysis Graph – Visualizing Market Share
#Market and Competitor Analysis #Graph #Market Share
-

Market Share Circle Graph – Ideal for Market Analysis
#Market and Competitor Analysis #Graph #Market Share
