Market Share and Analysis Graph – Red and Blue Integration
RJ0400028_10
- Last Update 05/25/2025
- File Size 1MB
- # of Slides 2
- File Format PPTX
- Slide Ratio 16:9
- Color
Keywords
About the Product
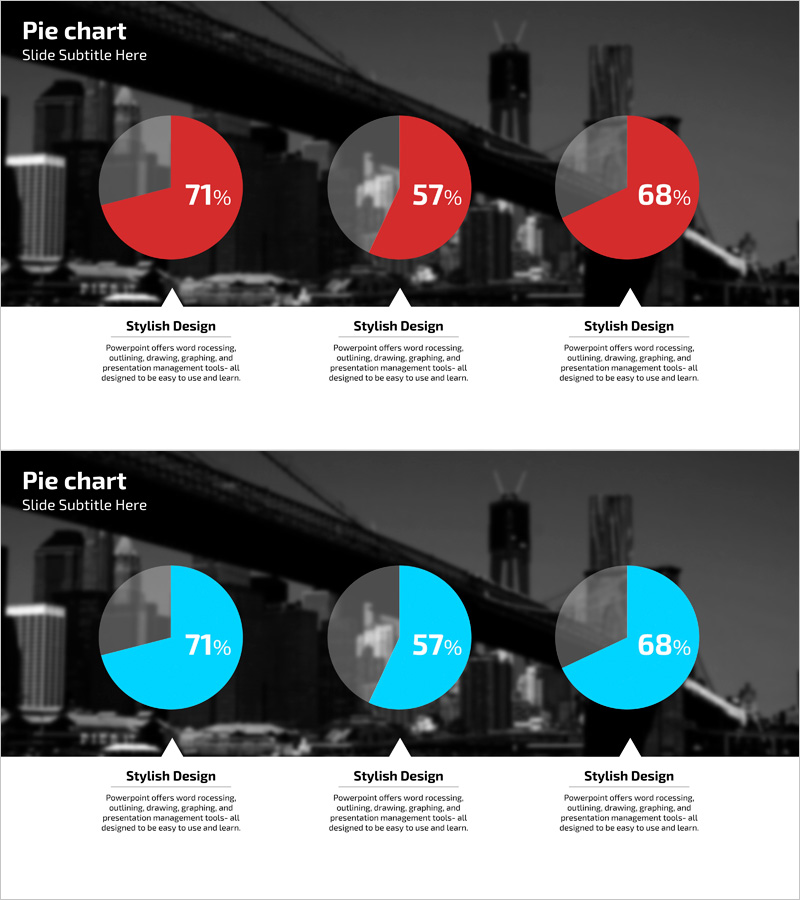
A professional pie chart PowerPoint slide designed for market share and competitive analysis presentations. Three circular pie charts are arranged horizontally with red and blue dual-tone color scheme, displaying specific percentages (71%, 57%, 68%) for each segment. The charts are overlaid on a semi-transparent dark urban cityscape background, creating strong visual impact and professional context. The 2-slide set includes both red-accent and blue-accent versions, allowing you to choose the version that best matches your presentation narrative. Delivered in 16:9 widescreen PPTX format, fully editable in all PowerPoint versions for immediate customization.
Usage Points
-
Main Usage
Visualize ratio-based data such as market share, competitive positioning, customer demographics, product sales distribution, and revenue breakdown using pie chart format. The red and blue dual-tone color scheme clearly distinguishes two categories or competitive scenarios, while the urban background image reinforces business presentation credibility.
-
How to Use
Integrate into business plans, marketing strategy presentations, investor pitch decks, and market analysis sections. Replace the sample percentages with your actual data, edit labels and titles as needed. Use the red-accent version to emphasize positive performance; use the blue version for objective analytical presentations.
-
Recommended For
Marketing professionals, executives, management consultants, financial analysts, and business strategists who present data-driven insights. Ideal for presentations covering market sizing, customer segmentation, product portfolio composition, and competitive landscape analysis.
-
Slide Structure
2-slide set with 3 pie charts arranged horizontally on each slide. Each pie chart features a 2-segment design (gray background + accent color segment) with percentage labels centered. First slide emphasizes red accent; second slide emphasizes blue accent for flexible presentation options.
Related Products
-

Analysis by Pie Chart Item – Visualizing Market Share
#Market and Competitor Analysis #Graph #Market Share
-

A Lively Green Orange Pie Chart
#Market and Competitor Analysis #Graph #Market Share
-

Kids’ Study Time Planner – Market Share Visualization
#Market and Competitor Analysis #Graph #Market Share
-

Sailing Travel Business Market Share Pie Chart Analysis
#Market and Competitor Analysis #Graph #Market Share
