Key Financial Indicators Table – Effective Data Presentation
RJ0300056_10
- Last Update 05/03/2025
- File Size 4MB
- # of Slides 2
- File Format PPTX
- Slide Ratio 16:9
- Color
Keywords
- #Content-Based Slides
- #Design-Based Slides
- #Financial Plans and Performance
- #Diagram
- #Income Statement
- #Key Financial Indicators
- #Table
- #Standard Table
- #16:9
- #financial indicators table PowerPoint
- #financial data slide template
- #income statement table
- #budget presentation slide
- #how to create financial table in PowerPoint
About the Product
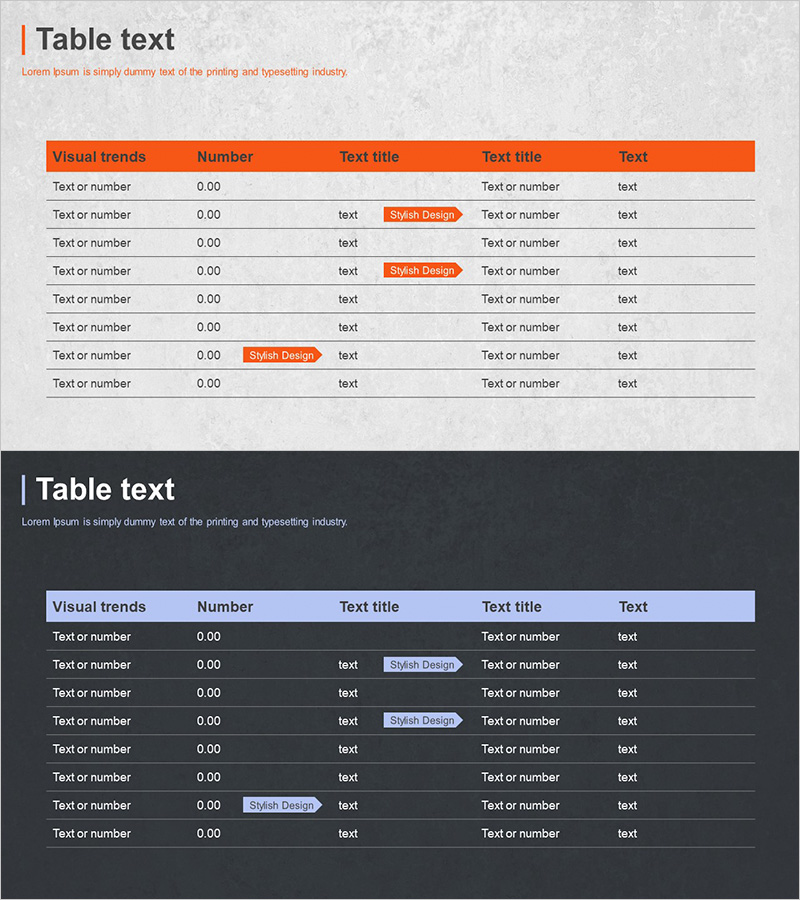
A 5-column financial data table PowerPoint slide that presents numerical information with clarity and impact. The orange header contrasts sharply against the white background, making key financial metrics stand out in your presentation. Perfect for income statements, financial ratios, budget summaries, and investment reports. This slide template allows you to input text and numbers directly, enabling quick creation of professional financial presentations. Use it in business reports, quarterly earnings calls, and investor pitches to communicate financial performance effectively.
Usage Points
-
Main Usage
Display financial metrics, budget allocations, and numerical comparisons in business reports, investment pitches, and quarterly reviews. The structured table format helps audiences quickly understand financial performance, cost breakdowns, and revenue projections at a glance.
-
How to Use
Enter item names in the left text column and corresponding numerical values in the Number column. Use the orange header to highlight section titles or category names. Adjust row colors as needed to emphasize critical financial figures or create visual hierarchy within the table.
-
Recommended For
Finance professionals, CFOs, accountants, and business executives presenting financial results. Ideal for quarterly earnings presentations, annual budget reviews, investor relations meetings, loan applications, and financial planning sessions where credibility and clarity are essential.
-
Slide Structure
Horizontal table with 5 columns (Visual trends, Number, Text title, Text title, Text) and 8 data rows. Orange header with white text provides strong visual contrast. White background with black text in data rows ensures readability. Sufficient space for comprehensive financial information display.
Related Products
-

Insight Summary Table – Visualizing Financial Plans and Performance
#Financial Plans and Performance #Diagram #Income Statement
-

Key Financial Indicators Table – Essential Information Visualization
#Financial Plans and Performance #Diagram #Income Statement
-

Illustration Theme Income Statement Table – Visualization of Financial Performance
#Financial Plans and Performance #Diagram #Income Statement
-

Premium Management Presentation Table – Efficient Financial Planning
#Financial Plans and Performance #Diagram #Income Statement
