Introducing Product Features with Advanced Radar Chart
RB0800003_18
- Last Update 03/17/2025
- File Size 0.1MB
- # of Slides 2
- File Format PPTX
- Slide Ratio 4:3
- Color
Keywords
About the Product
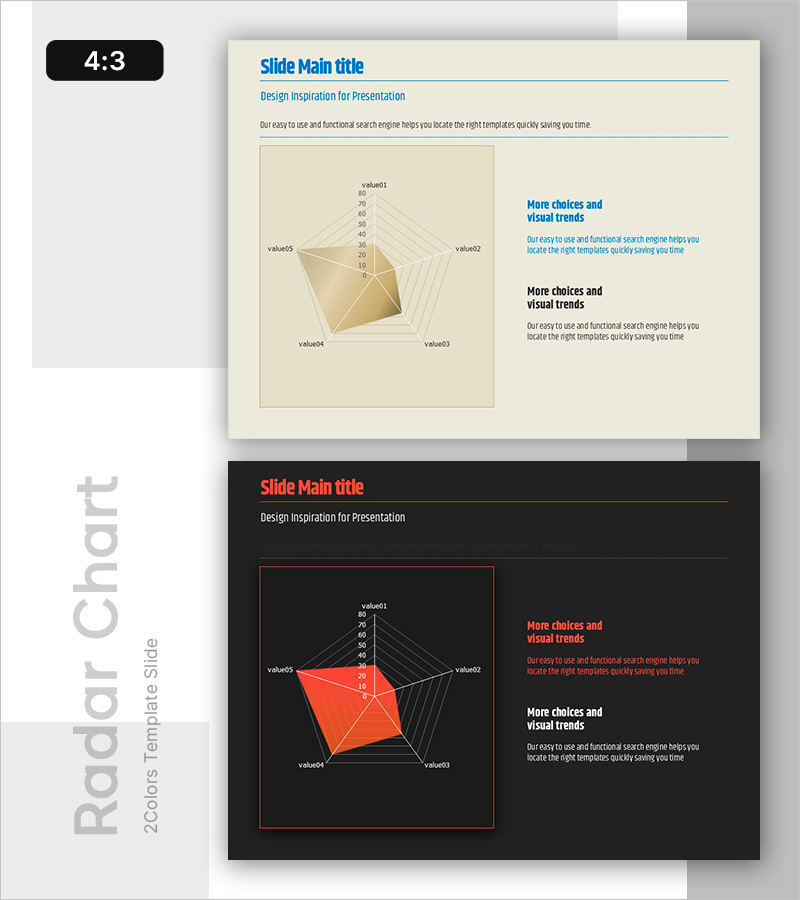
A PowerPoint slide featuring a 5-axis radar chart for visualizing multi-dimensional product data. The beige-background version displays a golden-filled radar diagram, while the black-background version uses orange fill for contrast. Both versions include gridlines and labeled axes (value01–value05) for clear data representation. Ideal for comparing product characteristics, competitive benchmarking, and performance metrics in presentations. The slide layout includes text boxes on the right for additional analysis and insights.
Usage Points
-
Main Usage
Visualize and compare multiple product or service dimensions (quality, price, performance, design, customer satisfaction) simultaneously across five axes. Effectively communicates competitive positioning, capability assessment, and performance benchmarking in business presentations.
-
How to Use
Enter item names and numerical values for each axis (value01 through value05) to populate the radar diagram. Select the beige version for bright, professional presentations or the black version for premium, high-impact meetings. Customize the text boxes on the right to add analysis commentary and key takeaways.
-
Recommended For
Product introduction decks, marketing strategy presentations, business proposals, executive reports, and investor pitch materials. Recommended for product management teams, marketing departments, sales teams, and C-level executives presenting multi-factor analysis and competitive comparisons.
-
Slide Structure
2-slide set. Slide 1: Beige background with golden-filled 5-axis radar chart including gridlines and axis labels. Slide 2: Black background with orange-filled radar chart. Both slides feature two text boxes on the right side for supplementary content and visual trends.
Related Products
-

Product Comparison Radar Chart – Competitive Advantage Analysis
#Product/Service Introduction #Market and Competitor Analysis #Graph
-

Fantastic Wide PPT Radar Chart – Visualizing Product Features and Benefits
#Product/Service Introduction #Graph #Product/Service Introduction
-

Radar Chart Analysis Results – Market and Competitor Insights
#Product/Service Introduction #Market and Competitor Analysis #Graph
-

Water and Plant Correlation Chart – Data Visualization
#Product/Service Introduction #Diagram #Graph
