Break Line Chart Analysis Summary - Market Status and Competitor Comparison
RB0800003_14
- Last Update 03/17/2025
- File Size 0.1MB
- # of Slides 2
- File Format PPTX
- Slide Ratio 4:3
- Color
Keywords
About the Product
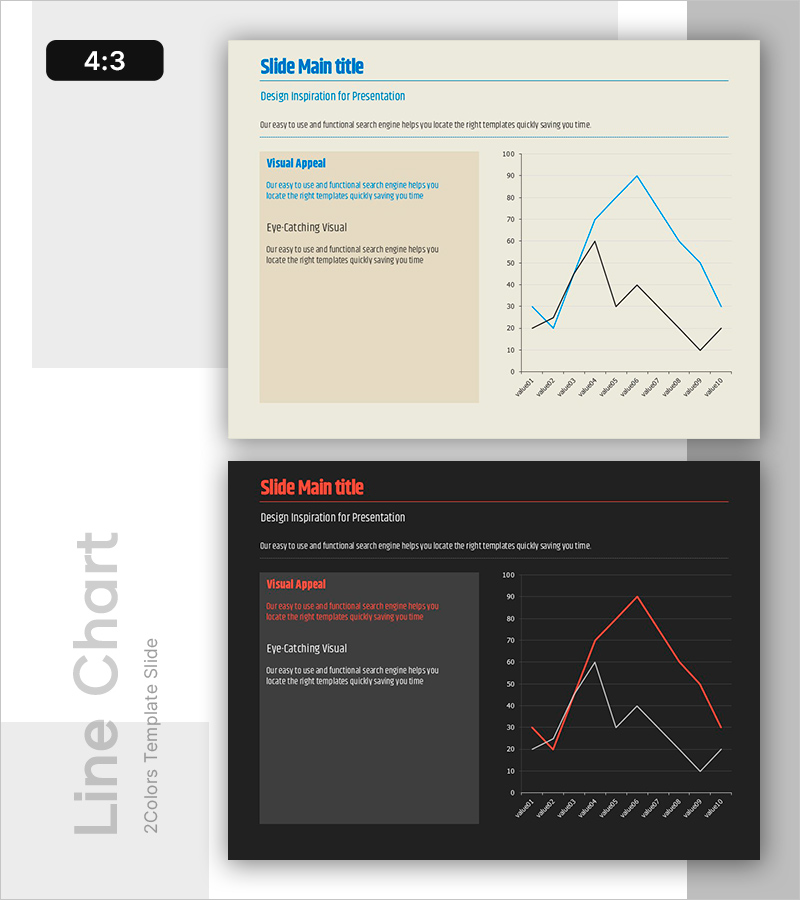
A dual-series line chart PowerPoint slide designed to compare market status and competitor performance at a glance. This presentation slide visualizes data trends over time using two distinct line series in blue and black, making it easy to identify performance differences and market shifts. The layout features a beige background with a two-column design: text area on the left for key insights and the line graph on the right for numerical evidence. The 4:3 aspect ratio with 2 slides provides ready-to-use templates for business analysis presentations and competitive benchmarking reports.
Usage Points
-
Main Usage
Visualize and compare market trends and competitor performance over time using a dual-series line chart. The two distinct line series enable intuitive comparison of performance differences, providing data-driven evidence for market positioning and strategic planning.
-
How to Use
Enter analysis results and key insights in the left text box, then update the graph data values with your actual figures. Use the blue and black line series to compare your company versus competitors, or two different market segments, presenting comparative performance clearly.
-
Recommended For
Marketing managers, strategy planners, and sales directors can use this slide for market status reports, quarterly performance analysis, and competitive analysis presentations. It is ideal for investor presentations and executive briefings where data-backed decision-making is essential.
-
Slide Structure
Two-slide template with light beige background featuring a left text area (Visual Appeal and Eye-Catching Visual sections) and right-side line chart (2 series with approximately 10 data points). A second dark-background version provides design flexibility to match your presentation theme.
Related Products
-

Usage Analysis Graph – Visualizing Market Status
#Market and Competitor Analysis #Diagram #Graph
-

Geometry Wide Line Graph – Perfect Choice for Market Analysis
#Market and Competitor Analysis #Graph #Market Status
-

Analyze Market with Aurora Bending Line Chart – Competition and Opportunities
#Market and Competitor Analysis #Graph #Market Status
-

Business Analysis Line Graph – Visualizing Market Trends
#Market and Competitor Analysis #Graph #Market Status
