Analyze Market with Aurora Bending Line Chart – Competition and Opportunities
RJ0600107_18
- Last Update 07/20/2025
- File Size 1.7MB
- # of Slides 2
- File Format PPTX
- Slide Ratio 16:9
- Color
Keywords
- #Content-Based Slides
- #Design-Based Slides
- #Market and Competitor Analysis
- #Graph
- #Market Status
- #Market Analysis
- #Line
- #Line Chart
- #16:9
- #line chart PowerPoint
- #market analysis slide template
- #trend comparison presentation
- #competitive analysis chart
- #data visualization PPT
- #line graph PowerPoint download
About the Product
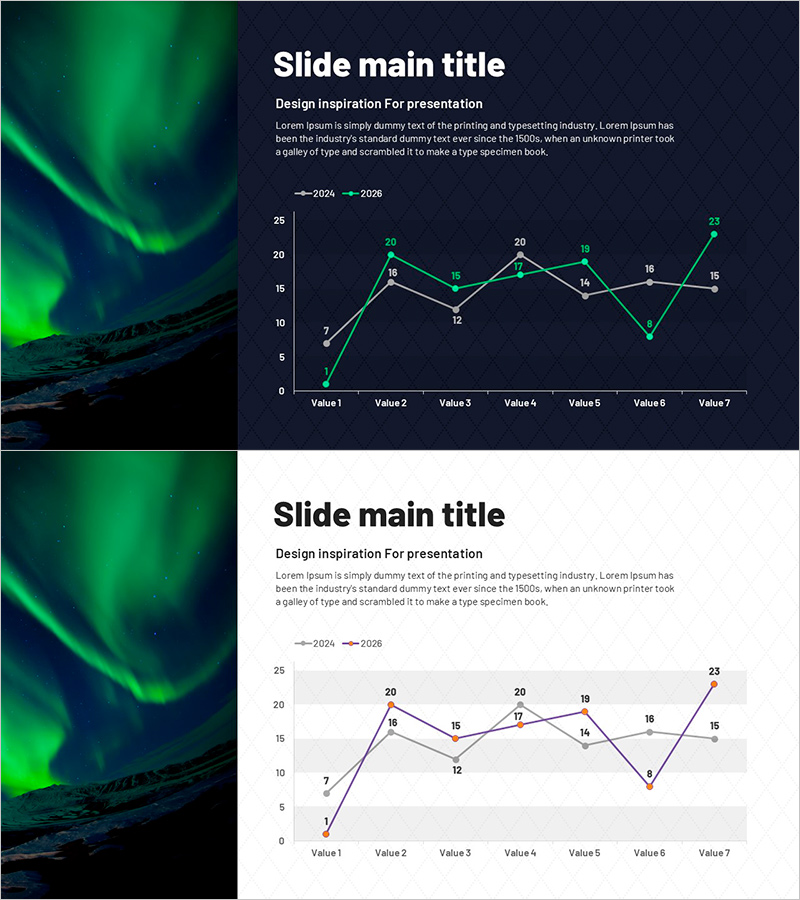
A PowerPoint slide featuring a dual-series line chart against an aurora borealis background. This presentation template compares 2024 and 2026 data across seven value points, visualizing market trends and competitive performance simultaneously. The dark navy background contrasts with lime green and pink accent lines, making data points stand out clearly. Each value is labeled numerically for precise comparison, making it ideal for market analysis sections in business reports, pitch decks, and marketing strategy presentations.
Usage Points
-
Main Usage
Simultaneously compare market trends and competitive performance using dual-series line visualization to clearly communicate market conditions. Effectively track monthly, quarterly, or annual data changes and illustrate performance differences between two groups or time periods.
-
How to Use
Insert into market analysis sections of marketing strategy presentations, competitive landscape slides in business reports, or performance comparison pages in investor presentations. Replace sample data with actual figures and customize colors to match corporate branding. Fully editable in PowerPoint format.
-
Recommended For
Marketing managers, business strategists, executives preparing quarterly reports, management consultants, and investor relations professionals presenting market conditions and competitive positioning. Ideal for presentations requiring period-over-period or year-over-year performance comparisons.
-
Slide Structure
Dark navy background with aurora borealis imagery on the left; dual-series line chart on the right featuring lime green and pink lines. X-axis displays 7 data points (Value 1–7), Y-axis ranges 0–25, numeric labels on each point, legend showing 2024 and 2026. Two-slide template set with consistent design.
Related Products
-

Geometry Wide Line Graph – Perfect Choice for Market Analysis
#Market and Competitor Analysis #Graph #Market Status
-

Break Line Chart Analysis Summary - Market Status and Competitor Comparison
#Market and Competitor Analysis #Graph #Market Status
-

Usage Analysis Graph – Visualizing Market Status
#Market and Competitor Analysis #Diagram #Graph
-

Consumer Insights & Behavioral Patterns Analysis Slide
#Market and Competitor Analysis #Graph #Market Status
