Yellow Red Line Charts and Tables – Market Status Analysis
RJ0600039_8
- Last Update 07/01/2025
- File Size 2.7MB
- # of Slides 2
- File Format PPTX
- Slide Ratio 16:9
- Color
Keywords
- #Content-Based Slides
- #Design-Based Slides
- #Market and Competitor Analysis
- #Diagram
- #Graph
- #Market Status
- #Market Analysis
- #Table
- #Line
- #Standard Table
- #Line Chart
- #16:9
- #line chart PowerPoint slide
- #dual-series trend analysis
- #how to create line chart in PowerPoint
- #market analysis presentation template
- #financial data visualization slide
About the Product
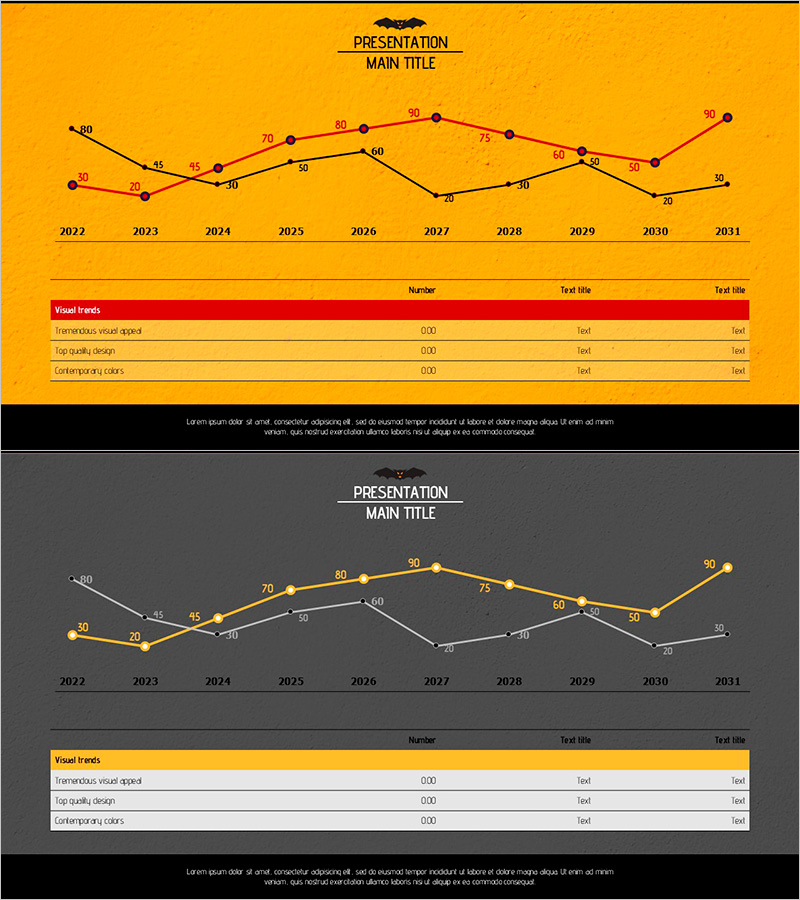
A dual-series line chart PowerPoint slide visualizing 10 years of market data from 2022 to 2031. The yellow and red data series enable simultaneous comparison of two key metrics, with numerical values displayed at each data point for precise information delivery. The slide includes a data table section at the bottom for additional context and analysis. Formatted in 16:9 widescreen ratio across 2 slides, ready for immediate editing and presentation use.
Usage Points
-
Main Usage
Compares two key performance indicators or metrics over time, with contrasting yellow and red color coding for clear visual distinction. Numerical labels at each data point ensure accurate data representation and facilitate audience comprehension of trend patterns.
-
How to Use
Apply to market analysis presentations, quarterly business reviews, investor pitch decks, competitive benchmarking reports, and financial performance summaries. Simply replace sample data with your own figures, and the chart updates automatically. Use the table section below the chart to provide supporting metrics or explanatory notes.
-
Recommended For
Executives, business analysts, marketing managers, financial officers, and data-driven professionals presenting quarterly results, market research findings, investment opportunities, or strategic performance metrics to stakeholders and decision-makers.
-
Slide Structure
Slide 1: Dual-series line chart (10 data points spanning 2022–2031) with yellow and red lines, title area, and year labels on x-axis. Slide 2: Identical chart structure with dark background variant, plus 3-row editable table below (Visual Trends header with columns for Number, Text Title, and Text Title). All elements are vector-based and fully editable.
Related Products
-

Green Analysis Chart for Market Overview – Effective Data Comparison
#Market and Competitor Analysis #Diagram #Graph
-

Usage Analysis Graph – Visualizing Market Status
#Market and Competitor Analysis #Diagram #Graph
-

Competitive Market Analysis Graph - Insights for Understanding the Market
#Market and Competitor Analysis #Diagram #Graph
-

Consumer Insights & Behavioral Patterns Analysis Slide
#Market and Competitor Analysis #Graph #Market Status
