Consumer Insights & Behavioral Patterns Analysis Slide
RM0400018_3
- Last Update 01/26/2026
- File Size 12.1MB
- # of Slides 2
- File Format PPTX
- Slide Ratio 16:9
- Color
Keywords
- #Content-Based Slides
- #Design-Based Slides
- #Market and Competitor Analysis
- #Graph
- #Market Status
- #Customer Analysis
- #Market Analysis
- #Column
- #Line
- #Column Chart
- #Line Chart
- #16:9
- #line chart PowerPoint slide
- #consumer behavior analysis presentation
- #marketing data visualization slide
- #trend analysis chart PPT
- #purchase behavior pattern PowerPoint template
About the Product
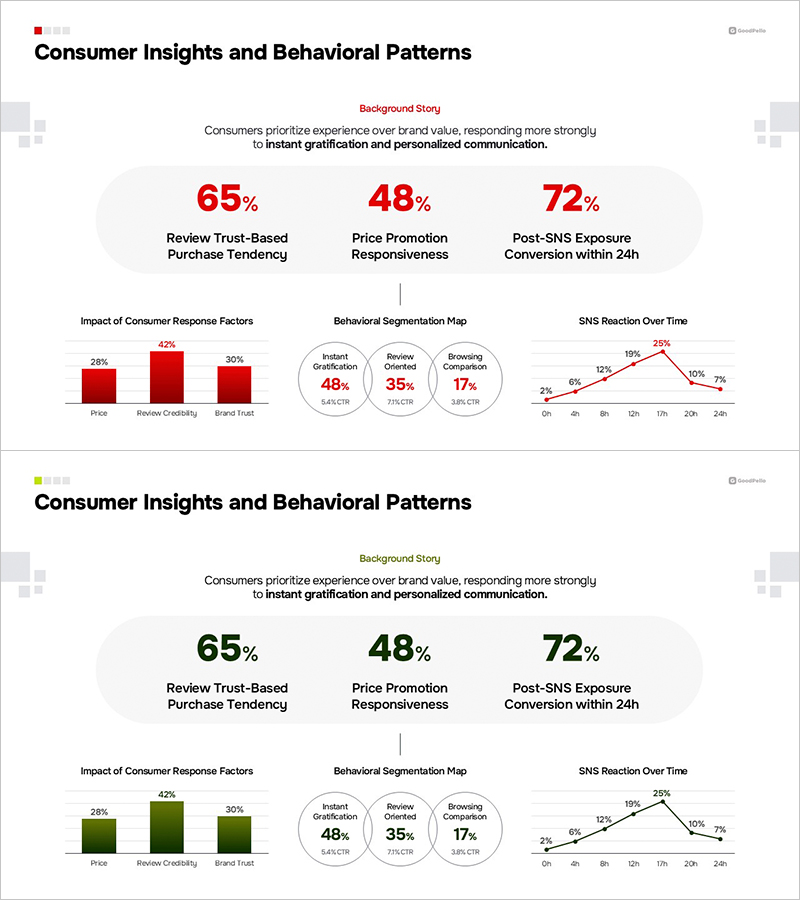
A 2-slide PowerPoint set visualizing consumer insights and behavioral patterns through line charts. Clearly represents multi-series data such as purchase behavior changes over time and SNS exposure conversion rate trends. Provided in two contrasting color versions—red and green—each slide combines large-scale numerical emphasis, pie diagrams, and bar charts for immediate use in marketing strategy presentations. Available in 16:9 widescreen PPTX format with full editing capability, optimized for consumer behavior analysis, marketing data visualization, and purchase pattern presentations.
Usage Points
-
Main Usage
Expresses consumer behavior changes over time, purchase conversion rate trends, and SNS exposure effects through line charts. Compares multi-series data simultaneously to visually present marketing performance analysis and strategic planning evidence.
-
How to Use
Use in marketing strategy presentations, consumer behavior analysis reports, and sales performance analysis presentations to emphasize time-series trends. Edit slide values and legends with your own data for immediate presentation use.
-
Recommended For
Marketing managers, data analysts, sales managers, and executives presenting consumer behavior changes, sales trends, and campaign effectiveness analysis will find this template highly effective.
-
Slide Structure
2-slide composition with each slide containing three large-scale percentage figures (65%, 48%, 72%), a pie diagram (3-segment), a bar chart (3 items), and a line chart (2–3 series, 0–24 hour time axis). Provided in red and green color versions, 16:9 aspect ratio PPTX format.
Related Products
-

Real Estate Sales and Consumer Analysis Slide
#Market and Competitor Analysis #Graph #Market Status
-

Internet Theme Segmentation Bar Graph – Market Status Analysis
#Market and Competitor Analysis #Graph #Market Status
-

Bar Chart for Portion of Meals – Visualizing Market Status
#Market and Competitor Analysis #Graph #Market Status
-

Curved Charts for Products – Visualizing Market Conditions with Diagrams
#Market and Competitor Analysis #Graph #Market Status
