Global Map and Donut Chart – Visualizing Market Share
RJ0900013_26
- Last Update 08/19/2025
- File Size 0.8MB
- # of Slides 2
- File Format PPTX
- Slide Ratio 16:9
- Color
Keywords
- #Content-Based Slides
- #Design-Based Slides
- #Company Introduction
- #Market and Competitor Analysis
- #Graph
- #Other
- #Global Network
- #Market Share
- #Circles
- #Doughnut Chart
- #Map
- #16:9
- #world map PowerPoint slide
- #global market analysis presentation
- #regional data visualization
- #donut chart PPT template
- #geographic market share slide
About the Product
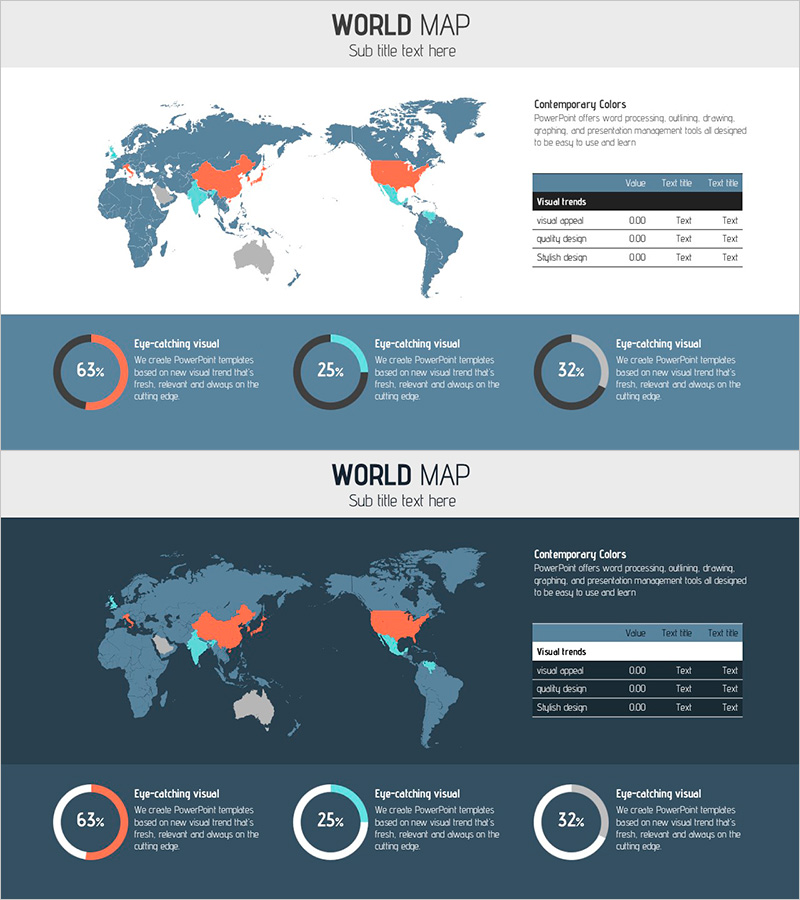
A comprehensive world map PowerPoint slide set featuring two design variations for global business strategy visualization. Each of the 2 slides combines a world map with highlighted regions (China, USA, Canada in red/orange) and a data table paired with three donut charts on the right side. Available in light and dark background options to suit different presentation contexts. The layout enables clear communication of market share, regional performance, and global network status at a glance. Instantly editable and ready for investor presentations, executive reports, and strategic planning decks.
Usage Points
-
Main Usage
Visualize global business status, market share, and regional performance using integrated map and chart design. Highlighted countries (China, USA, Canada) draw focus to key markets while three donut charts display proportional data for each region, enhancing persuasiveness in international strategy presentations.
-
How to Use
Deploy in investor briefings, executive reports, and international marketing strategy presentations. Light tone conveys optimism and trust; dark tone projects professionalism and premium positioning. Easily customize the data table and chart values to match your metrics for immediate use.
-
Recommended For
Global business managers, marketing strategists, executives, investor relations professionals, and consultants presenting international market analysis, regional performance reports, and global network expansion. Ideal for multinational corporations, import-export companies, and international consulting firms.
-
Slide Structure
Both slides follow identical layout: title area at top, world map on left with 2-3 highlighted countries, data table (Value, Text title, Text title columns) upper right, three donut charts (sample data: 63%, 25%, 32%) lower right. Background color differentiates light vs. dark theme.
Related Products
-

Global Food Distribution Map – Insight into the Market
#Company Introduction #Market and Competitor Analysis #Graph
-

Visualizing South Korea's Market Share – Data-Driven Insights
#Company Introduction #Market and Competitor Analysis #Graph
-

Orange Hexagon Template World Map – Market Analysis Insights
#Market and Competitor Analysis #Graph #Other
-

Country-by-country Status Analysis Map Template
#Company Introduction #Graph #Other
