Expanding Insights with Pie Chart Analysis – Market Share Statistics
RB0800002_13
- Last Update 03/17/2025
- File Size 0.1MB
- # of Slides 2
- File Format PPTX
- Slide Ratio 4:3
- Color
Keywords
About the Product
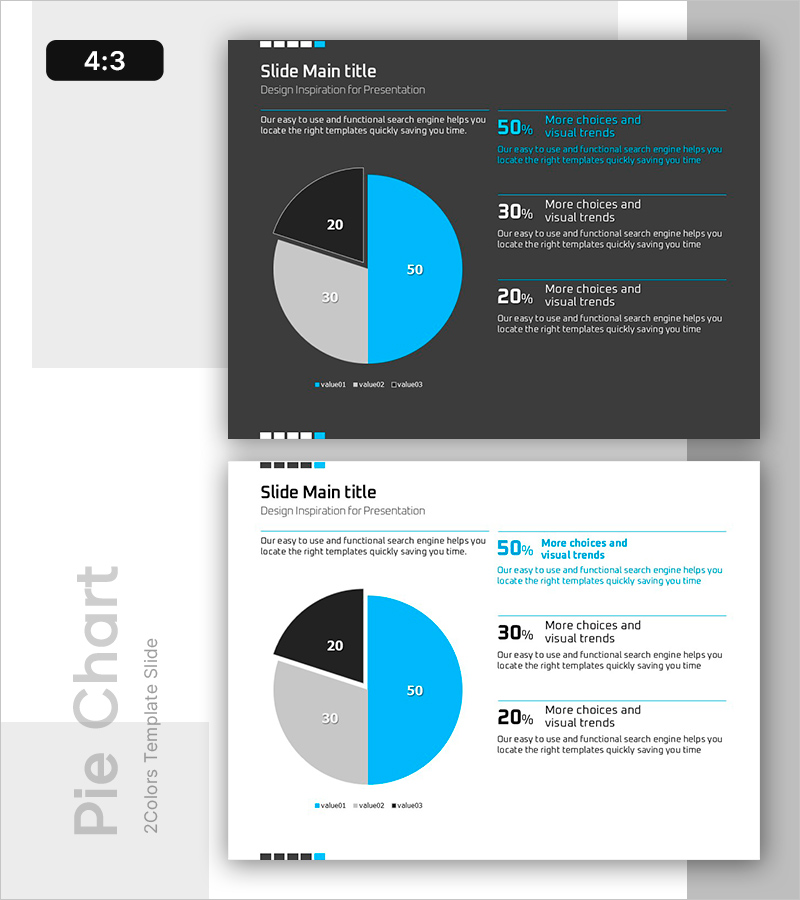
A professional pie chart PowerPoint slide designed to visualize market share and data distribution with three segments. The slide features a three-part circular chart in cyan blue, light gray, and charcoal colors displaying percentages (50%, 30%, 20%) against a dark gray background. The right side includes a text area for detailed explanations of each segment. Provided as a 4:3 ratio, 2-slide template in PPTX format. Ideal for business presentations, marketing plans, market analysis reports, competitive comparisons, customer demographics, and revenue structure breakdowns.
Usage Points
-
Main Usage
Visualize market share, customer composition, revenue structure, and budget allocation by displaying each segment's proportion in a pie chart format. Enables audiences to instantly grasp data structure and relationships. Optimized for comparing three key segments.
-
How to Use
Apply in market analysis sections of marketing plans, performance analysis in business reports, and business structure explanations in investor presentations. Edit the percentage values to match your actual data and add interpretations and insights in the right text area.
-
Recommended For
Marketing professionals, executives, business analysts, and consultants explaining market conditions, competitive landscape, and customer distribution. Particularly effective for presentations requiring three-way proportion comparisons.
-
Slide Structure
2-slide template with dark gray background. Each slide contains a three-segment pie chart (cyan blue 50%, light gray 30%, charcoal 20%) with an adjacent text explanation area. White typography and cyan blue accent lines create strong visual contrast.
Related Products
-

Market Share Visualization of Three Countries – Effective Data Analysis
#Market and Competitor Analysis #Graph #Other
-

Market Share Circle Graph – Ideal for Market Analysis
#Market and Competitor Analysis #Graph #Market Share
-

Market Share Analysis Graph – Effective Market Insights
#Market and Competitor Analysis #Graph #Market Share
-

Design Pattern Template Pie Chart – Market Share Analysis
#Market and Competitor Analysis #Graph #Market Share
