Performance Line Chart – Competitive Advantage Through Data Visualization
RB0800001_18
- Last Update 03/17/2025
- File Size 0.5MB
- # of Slides 2
- File Format PPTX
- Slide Ratio 4:3
- Color
Keywords
About the Product
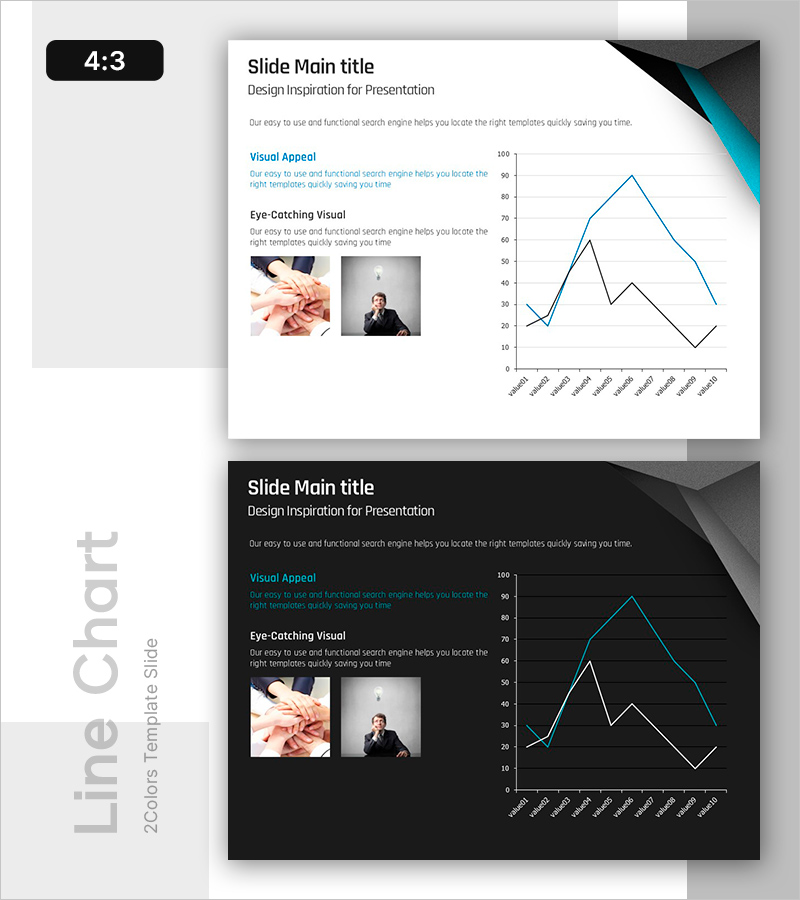
A PowerPoint slide featuring a dual-series line chart that visualizes performance data across two comparable metrics. The teal and black lines represent distinct data streams, making it ideal for competitive analysis, market performance tracking, and sales trend reporting. Formatted in 4:3 aspect ratio with 2 slides, this template is ready to customize with your own values. The layout combines chart visualization with text and image areas, enabling comprehensive data storytelling in business presentations, quarterly reports, and investor pitches.
Usage Points
-
Main Usage
Visualize two related performance metrics side-by-side to highlight competitive advantage, market share evolution, or sales trajectory over time. The dual-line format enables direct comparison between your organization's performance and competitor benchmarks, or between different product lines and business units.
-
How to Use
Replace the axis labels and data points with your actual figures. Update the text sections titled 'Visual Appeal' and 'Eye-Catching Visual' with your own headings and supporting descriptions. Modify the two placeholder images to match your content. Line colors can be adjusted to align with your corporate branding guidelines.
-
Recommended For
Executives, marketing managers, sales leaders, financial analysts, and business consultants presenting quantitative performance data. Ideal for business plans, quarterly earnings reports, investor relations presentations, marketing strategy decks, and competitive positioning documents.
-
Slide Structure
Two-slide set in 4:3 format. Each slide contains a dual-series line chart (teal and black lines) with 10 data points on the horizontal axis (value01–value10) and a 0–100 scale on the vertical axis. Layout includes a title area at top, text and two image placeholders on the left, and the chart on the right for balanced information hierarchy.
Related Products
-

Line Chart of the Violence Survey – Market Analysis and Competitive Advantage
#Market and Competitor Analysis #Graph #Market Analysis
-

Vegetable Market Status Analysis with Line Charts
#Market and Competitor Analysis #Graph #Market Status
-

Accumulated Line Chart – Market and Competitor Analysis
#Market and Competitor Analysis #Financial Plans and Performance #Graph
-

Brown Blue Detailed Analysis Chart - Market and Competitor Analysis
#Market and Competitor Analysis #Diagram #Graph
