Analysis of Market Competitive Advantage of Animal Nature Conservation Program
RJ0600074_23
- Last Update 07/09/2025
- File Size 3.2MB
- # of Slides 2
- File Format PPTX
- Slide Ratio 16:9
- Color
Keywords
About the Product
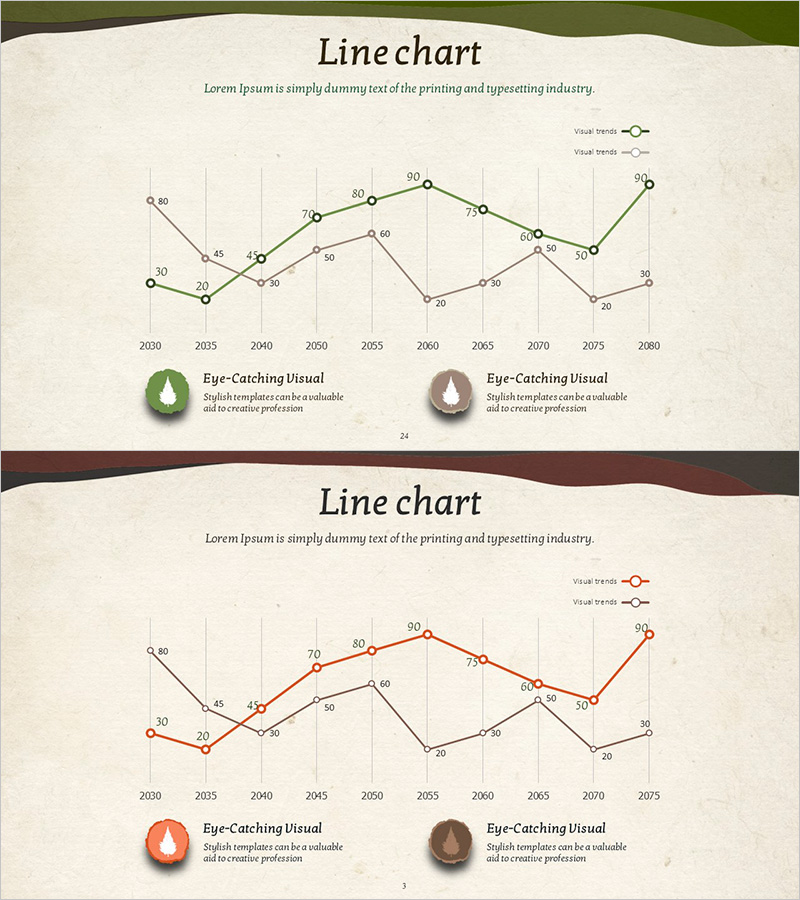
A dual-series line chart PowerPoint slide that compares time-series data across a 10-year period from 2030 to 2080. Each data point is labeled with precise numerical values, enabling clear communication of trend changes. The design features a beige background with green and gray line series to distinguish between two trends, supported by a legend and icons for intuitive understanding. This presentation slide is ready to use for market analysis, competitive advantage comparison, performance trend reporting, and various business presentations.
Usage Points
-
Main Usage
Designed to compare and analyze two data series simultaneously over time, making it ideal for visualizing market share changes, competitor performance benchmarking, and revenue trend analysis. The clear dual-line representation supports strategic decision-making by highlighting long-term trends and comparative patterns.
-
How to Use
Replace the data points and numerical values with your actual data. Line colors and legend labels can be customized to match your presentation theme. The grid background facilitates easy data reading. Suitable for annual performance presentations, market analysis reports, executive briefings, and strategic planning sessions.
-
Recommended For
Marketing professionals, business analysts, financial officers, consultants, and researchers presenting market trends, competitive analysis, and performance metrics. Ideal for business plans, quarterly reports, investor presentations, and strategic planning meetings.
-
Slide Structure
Two-slide set, each containing a dual-series line chart. The horizontal axis represents 10-year intervals from 2030 to 2080, while the vertical axis shows values from 0 to 90. Each data point displays its exact numerical value. A legend and icons clearly distinguish the two data series, enabling effective multi-series comparison and trend visualization.
Related Products
-

Competitor Analysis Broken Line Graph – Market Dominance and Competitive Advantage
#Market and Competitor Analysis #Graph #Competitor Analysis
-

Idea Presentation Template Wide Line Chart
#Market and Competitor Analysis #Graph #Industry Trends
-

Korea China Japan Analysis Graph – Market Competitive Advantage
#Market and Competitor Analysis #Graph #Other
-

Broken Line Comparison Graph – Optimized for Market and Competitor Analysis
#Market and Competitor Analysis #Graph #Competitor Analysis
