Idea Presentation Template Wide Line Chart
RJ0200030_8
- Last Update 04/06/2025
- File Size 0.7MB
- # of Slides 2
- File Format PPTX
- Slide Ratio 16:9
- Color
Keywords
About the Product
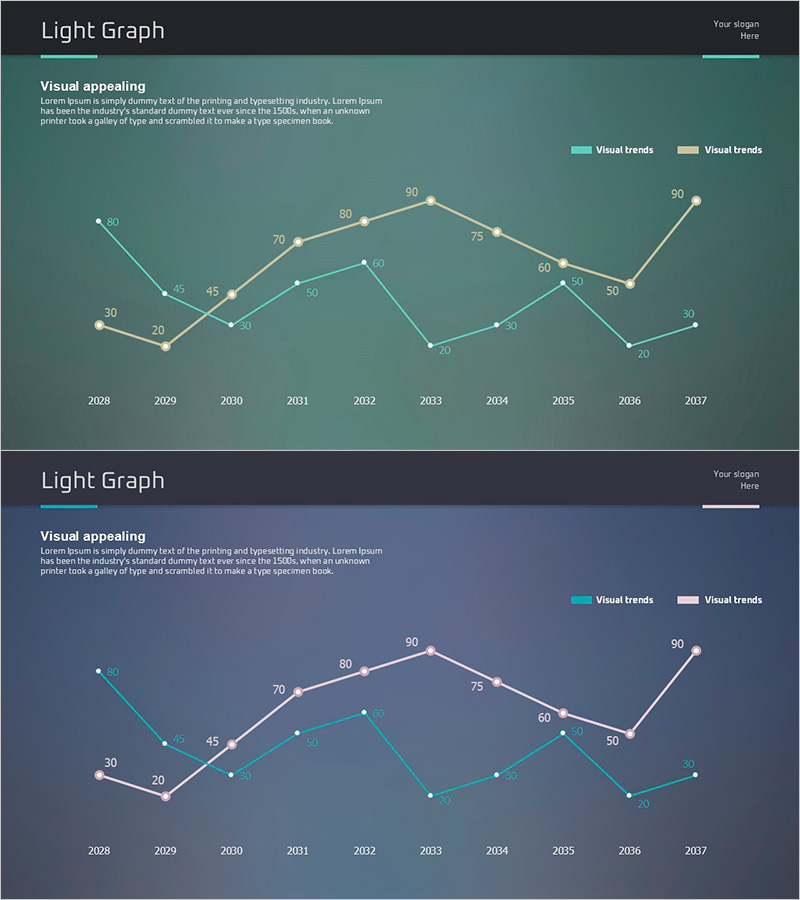
A multi-series line chart PowerPoint slide that compares two data trends across a 10-year period from 2008 to 2017. The two data series are distinguished by teal and beige colors, with numeric labels displayed at each data point for precise value reference. This presentation slide is ideal for business reports, market analysis, competitive benchmarking, and performance trend presentations where quantitative data visualization is essential. The slide template is ready to download and customize with your own data.
Usage Points
-
Main Usage
Visualize and compare two data trends over time using a dual-series line chart format. Effectively communicate long-term changes in metrics such as market growth rates, competitor market share, revenue trends, or customer satisfaction scores with precise numeric values displayed at each data point.
-
How to Use
Insert this slide into business reports, strategy presentations, or market analysis decks in the data visualization section. Replace the numeric values with your actual data, update the legend labels (Visual trends) to match your specific metrics, and adjust the teal and beige colors to align with your corporate brand guidelines.
-
Recommended For
Executive reports, quarterly performance presentations, market research findings, competitive analysis documents, investor pitch decks (IR materials), marketing performance reviews, and any business presentation requiring quantitative data comparison and trend analysis.
-
Slide Structure
Two identical slides with consistent layout. Title area at top (Visual appealing), dual-series line chart in center with 10 data points per series, year axis at bottom (2008–2017), legend on right side. Background features a teal gradient for visual cohesion.
Related Products
-

Dual Line Chart with Comments – Market Trend Analysis
#Market and Competitor Analysis #Graph #Text Box
-

Market Trend Line Graph – Effective Competitive Advantage Analysis
#Market and Competitor Analysis #Graph #Industry Trends
-

Curved Line Chart – Market Trend Analysis
#Market and Competitor Analysis #Graph #Industry Trends
-

Plotting Paper Presentation Template - Analyzing Market Trends with Line Chart
#Market and Competitor Analysis #Graph #Industry Trends
