Galaxy Theme Market Analysis Horizontal Table
RJ0400001_12
- Last Update 05/17/2025
- File Size 13.8MB
- # of Slides 2
- File Format PPTX
- Slide Ratio 16:9
- Color
Keywords
- #Content-Based Slides
- #Design-Based Slides
- #Market and Competitor Analysis
- #Financial Plans and Performance
- #Diagram
- #Market Analysis
- #Capital Requirements
- #Table
- #Standard Table
- #16:9
- #horizontal table PowerPoint
- #data comparison slide template
- #market analysis table
- #5-column table PPT
- #galaxy theme presentation
- #financial data visualization PowerPoint
About the Product
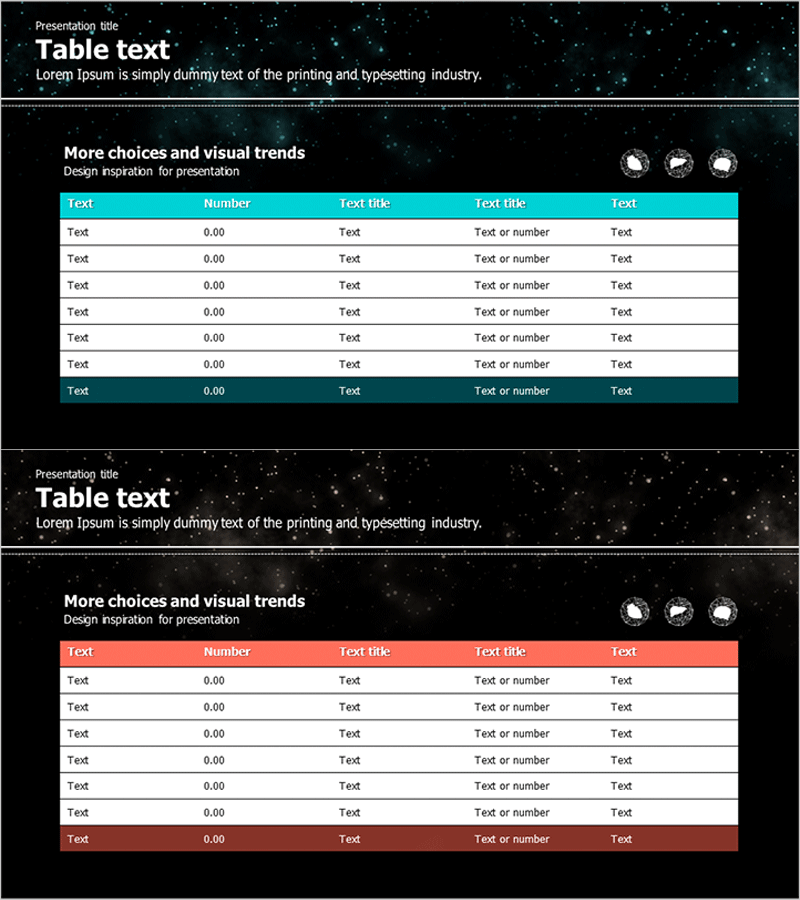
A horizontal table PowerPoint slide with a dark galaxy-themed background and cyan-orange dual-tone headers, designed for presenting quantitative data. The table features 5 columns and 7 rows, making it ideal for market analysis, financial planning, and competitive comparisons. Header and footer rows are highlighted in accent colors to establish clear information hierarchy, while all cells support direct text and numeric input. The 2-slide set allows multiple data presentations within a single template, optimized for modern 16:9 widescreen presentations.
Usage Points
-
Main Usage
This table slide is optimized for presenting quantitative data and comparative information in a structured format. It works effectively in market analysis sections for competitor comparisons, financial sections for numerical data organization, and business plan budgets for item-by-item comparisons. The accent-colored header and footer rows provide visual hierarchy that guides audience attention to key information.
-
How to Use
Simply input your text and numbers directly into each cell for instant customization. The dark galaxy background provides high contrast in projector environments, making it suitable for large conference room presentations. Rows and columns can be added or removed as needed, and colors can be adjusted to match corporate brand guidelines.
-
Recommended For
Ideal for executive reports, business plans, investor pitch decks, marketing strategy presentations, and quarterly performance reviews. Particularly effective when comparing multiple items simultaneously in market analysis, financial planning, and competitive analysis sections. Commonly used in finance, consulting, and manufacturing industries where data-driven decision-making is critical.
-
Slide Structure
2-slide set with each slide containing a 5-column (Text, Number, Text title, Text title, Text) and 7-row (1 header + 5 data + 1 footer) horizontal table. Header and footer rows feature cyan or orange backgrounds for emphasis, while data rows use white backgrounds for readability. Optimized for 16:9 widescreen format with fully editable cells.
Related Products
-

Corn Composition Analysis Table – Market Analysis and Financial Performance
#Market and Competitor Analysis #Financial Plans and Performance #Diagram
-

Market Trend Analysis Charts & Tables – The Power of Data Visualization
#Market and Competitor Analysis #Diagram #Graph
-

Performance Analysis Pie Chart – Market Share Visualization
#Market and Competitor Analysis #Diagram #Graph
-

Trend Color Wide Template Table – Emphasizing Financial Planning and Performance
#Financial Plans and Performance #Diagram #Capital Requirements
