Gender Ratio Analysis of Coffee Consumers - Consumption Patterns of Men and Women
RB0700028_5
- Last Update 03/16/2025
- File Size 1.9MB
- # of Slides 2
- File Format PPTX
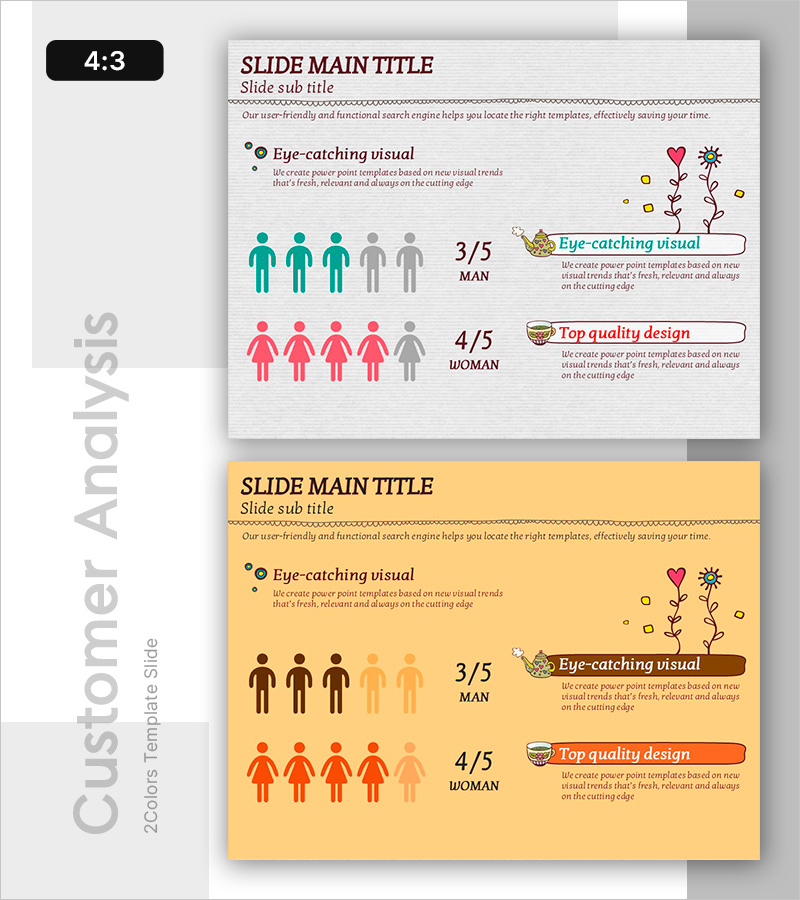
- Slide Ratio 4:3
- Color
Keywords
About the Product
A PowerPoint slide that visualizes the gender ratio and consumption patterns of coffee consumers at a glance. Male and female consumers are represented through icons, with rating scores (3/5, 4/5) displayed alongside to convey both qualitative and quantitative data simultaneously. The infographic uses gray, pink, and teal tones to clearly distinguish between genders, while text description areas allow detailed explanation of each group's characteristics. This slide is ideal for market analysis, consumer research, and marketing presentations where you need to persuasively communicate target customer demographics.
Usage Points
-
Main Usage
Optimized for classifying consumer groups by gender and comparing characteristics and ratings of each segment. Icon-based infographic transforms complex statistical data into intuitive visuals that enhance audience comprehension.
-
How to Use
Use in marketing strategy documents, market analysis reports, and consumer research presentations to explain target customer gender composition and characteristics. Simply modify the number of male/female icons and scores with actual data for immediate deployment.
-
Recommended For
Marketing teams, market research departments, product planning teams, and sales teams presenting consumer analysis findings to executives, investors, and partners. Particularly suited for beverage, fashion, beauty, and financial services industries requiring gender-based segmentation strategies.
-
Slide Structure
Two-slide set: First slide features title, subtitle, description text area with 5 male and 5 female icons arranged side-by-side; second slide provides identical layout with alternate color scheme (yellow background) for emphasis and contrast. Each slide includes 2 rating input areas (3/5, 4/5) and 2 text description boxes for customization.
Related Products
-

A Chart for the Total Population – Effective Market Analysis
#Market and Competitor Analysis #Diagram #Graph
-

Customer and Market Analysis Slide – Yellow and Bluegreen Emotion
#Market and Competitor Analysis #Graph #Other
-

User Analysis Results Diagram - Infographic for Customer Insights
#Market and Competitor Analysis #Graph #Other
-

Comparative Chart of Male and Female Professionals
#Market and Competitor Analysis #Graph #Other
