Line Chart for Performance Variation Visualization – The Basics of Presentation
RB0700021_9
- Last Update 03/16/2025
- File Size 0.4MB
- # of Slides 2
- File Format PPTX
- Slide Ratio 4:3
- Color
Keywords
About the Product
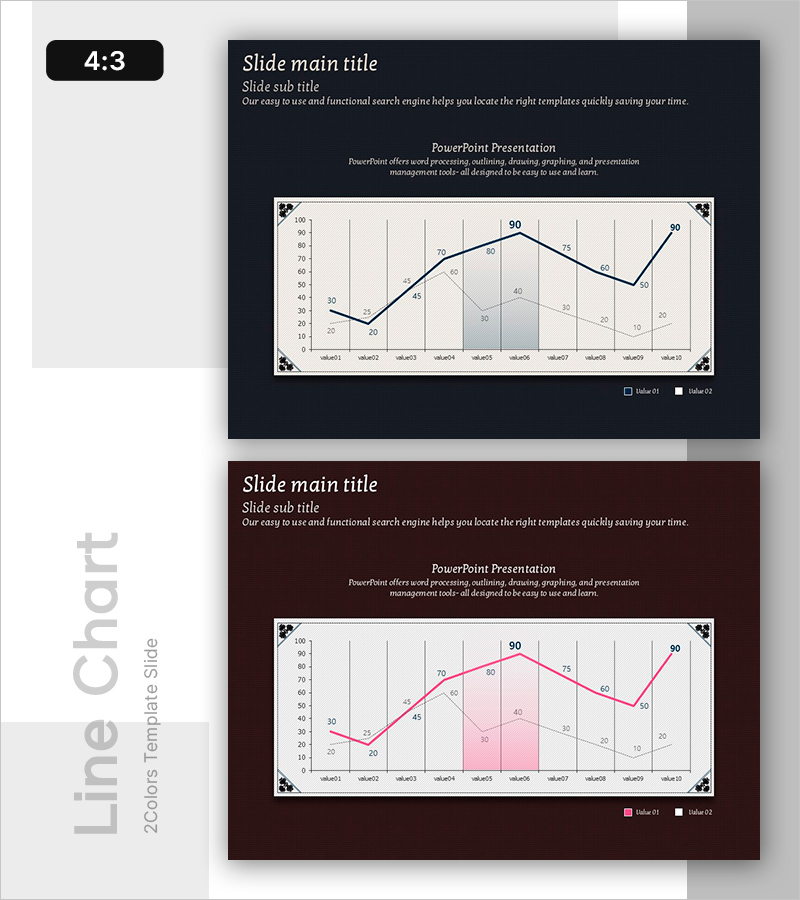
A 2-slide line chart PowerPoint template featuring dual-series trend visualization on a dark navy background. The design includes white gridlines, blue and pink trend lines with 10 labeled data points each, and clear axis labels for comprehensive data analysis. Ideal for presenting sales performance, growth metrics, market trends, and business KPIs. The 4:3 aspect ratio PPTX format is fully editable and ready to integrate into business reports, quarterly reviews, investor presentations, and analytical slideshows.
Usage Points
-
Main Usage
Visualizes temporal data changes and trend patterns with clarity and precision. Enables simultaneous comparison of multiple data series, making it ideal for tracking sales revenue, website traffic, growth rates, market share, and other continuous metrics over time.
-
How to Use
Apply to quarterly earnings reports, business performance reviews, marketing campaign ROI analysis, financial status presentations, customer satisfaction trend tracking, and strategic planning sessions. Simply replace the sample data and labels with your own figures for immediate use in professional presentations.
-
Recommended For
Executives, finance teams, marketing professionals, sales managers, data analysts, management consultants, and project managers who need data-driven decision-making support. Suitable for board meetings, investor relations, internal performance reviews, strategic planning workshops, and analytical presentations.
-
Slide Structure
Two-slide layout: Slide 1 features a blue trend line with 10 data points on dark navy background; Slide 2 displays a pink trend line with 10 data points. Both slides include gridlines, axis labels, numerical annotations, and legend indicators for optimal readability and professional appearance.
Related Products
-

Adventure Business Line Graph Slide for Market Research
#Market and Competitor Analysis #Graph #Market Analysis
-

Market Analysis Template with Line Graphs and Horizontal Bar Charts
#Market and Competitor Analysis #Graph #Market Analysis
-

Blue Yellow Line Graph – Market and Competitive Analysis
#Market and Competitor Analysis #Graph #Market Analysis
-

Stock Market Trend Graph
#Market and Competitor Analysis #Graph #Market Analysis
