Market Analysis Template with Line Graphs and Horizontal Bar Charts
RJ0300016_11
- Last Update 04/22/2025
- File Size 1.4MB
- # of Slides 2
- File Format PPTX
- Slide Ratio 16:9
- Color
Keywords
- #Content-Based Slides
- #Design-Based Slides
- #Market and Competitor Analysis
- #Graph
- #Market Analysis
- #Industry Trends
- #Horizontal Bar
- #Line
- #Horizontal Bar Chart
- #Line Chart
- #16:9
- #line graph PowerPoint slide
- #trend analysis chart template
- #horizontal bar chart slide
- #market analysis presentation
- #competitive analysis PowerPoint
- #multi-series data visualization
About the Product
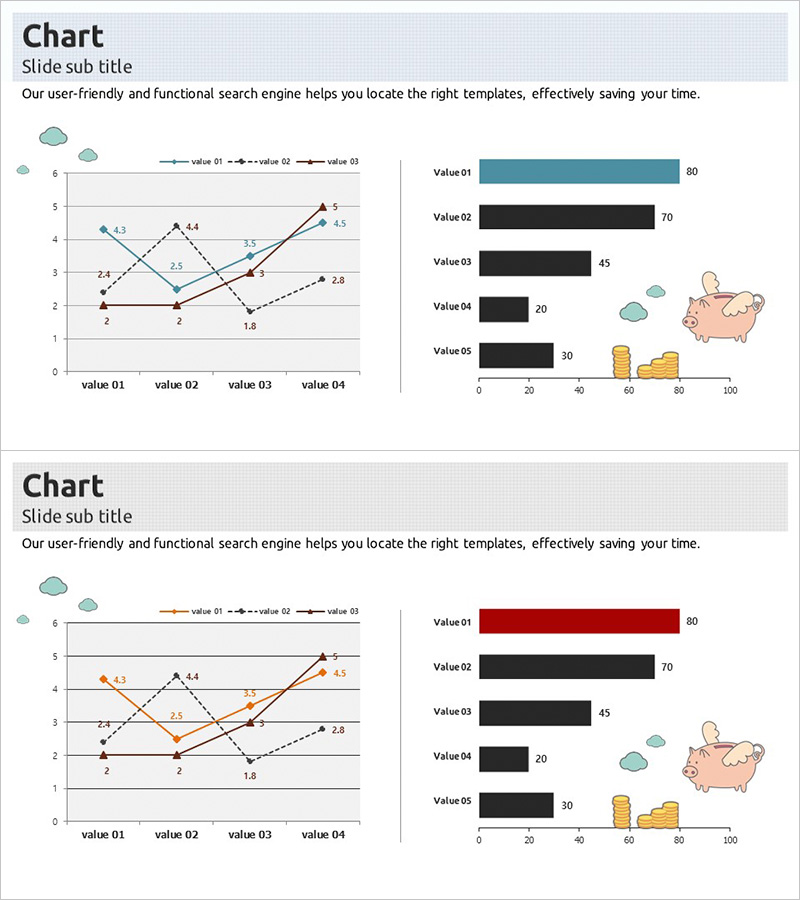
A market analysis PowerPoint slide combining multi-series line graphs with horizontal bar charts for comprehensive data visualization. The left side displays three trend lines tracking changes across four data points, while the right side shows five comparative metrics in horizontal bars. Color-coded in teal, black, and orange for clear data distinction, with decorative icons (clouds, piggy bank, coins) enhancing presentation clarity. The 2-slide set includes layout variations, allowing immediate customization for your specific market data and competitive analysis needs.
Usage Points
-
Main Usage
Present time-series market trends alongside competitive performance metrics in a single visual. The line graph emphasizes change trajectories while horizontal bars highlight absolute value comparisons, enabling data-driven decision-making in business presentations.
-
How to Use
Insert into business reports, marketing strategy presentations, investor pitches, and quarterly performance reviews. Replace sample data with your actual figures and adjust colors or series count to match your analysis scope (revenue trends, customer satisfaction, market share, etc.).
-
Recommended For
Executives, marketing managers, sales directors, management consultants, financial analysts, and business strategists. Ideal for quarterly earnings presentations, competitive landscape assessments, market opportunity evaluations, and strategic planning sessions.
-
Slide Structure
Left panel: line graph with 4 X-axis intervals (value 01–04) tracking 3 data series with trend lines and data point markers. Right panel: horizontal bar chart displaying 5 items (Value 01–05) on 0–100 scale. Two-slide set demonstrates color variations (teal and orange themes) for flexible design adaptation.
Related Products
-

Service Market Trends and Analysis Slide (Red and Blue)
#Market and Competitor Analysis #Diagram #Graph
-

City Background Broken Line Graph – Market Trend Analysis
#Market and Competitor Analysis #Graph #Market Analysis
-

Chart of Industry Change and Global Market Outlook Analysis
#Market and Competitor Analysis #Graph #Market Analysis
-

Key Performance Bar & Line Analysis Chart – Integrated Market Performance Visualization
#Company Introduction #Market and Competitor Analysis #Graph
