Donut Chart by Gender in Old Age – Customer Analysis and Feedback
RB0700014_7
- Last Update 03/16/2025
- File Size 3.4MB
- # of Slides 2
- File Format PPTX
- Slide Ratio 4:3
- Color
Keywords
- #Content-Based Slides
- #Design-Based Slides
- #Market and Competitor Analysis
- #Customer Success Stories
- #Graph
- #Customer Analysis
- #Customer Testimonials and Feedback
- #Circles
- #Doughnut Chart
- #4:3
- #donut chart PowerPoint
- #pie chart slide template
- #customer analysis presentation
- #gender comparison chart
- #demographic data visualization
About the Product
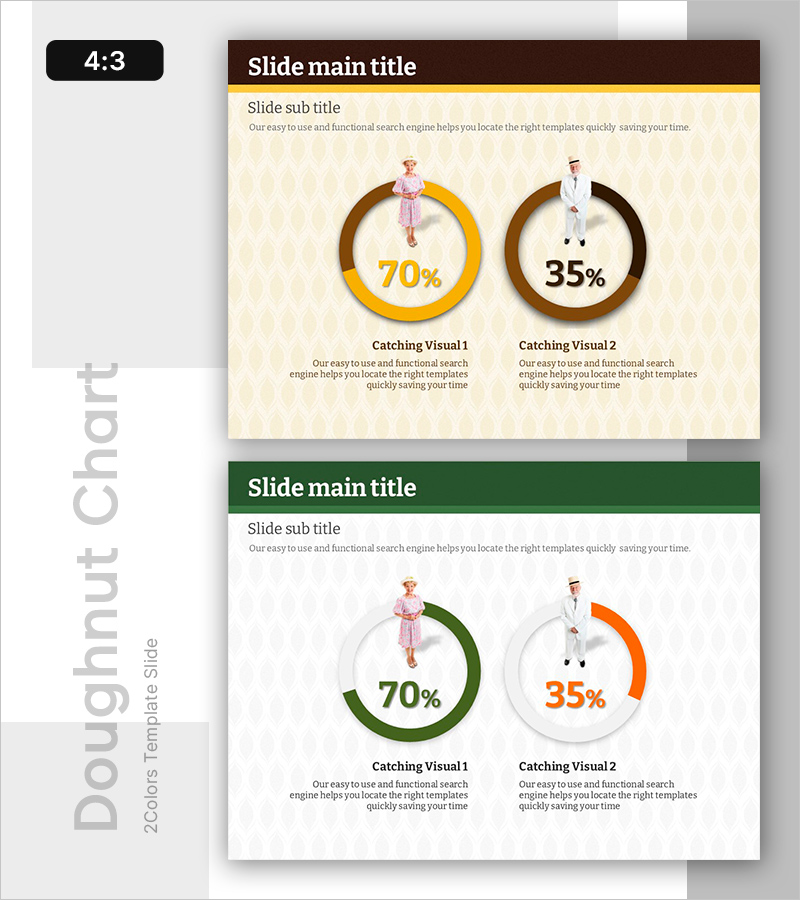
A 2-slide PowerPoint presentation featuring donut charts for customer analysis and demographic feedback visualization. The slides display dual donut graphs in gold and brown tones, with percentage values centered in each chart for immediate data comprehension. Cream-colored diamond pattern backgrounds and character illustrations enhance presentation credibility. This ready-to-use slide template is ideal for customer segmentation, market research, and marketing analysis reports in business presentations.
Usage Points
-
Main Usage
Visualize customer segmentation data using donut charts to intuitively communicate gender and age group distribution percentages. Effectively highlights key statistics in marketing analysis, market research, and customer feedback reports.
-
How to Use
Input actual percentage values into each donut chart and replace legend text with your customer segment names. Colors and numbers are fully editable, and you can duplicate chart shapes to add additional data series as needed.
-
Recommended For
Marketing managers, sales analysis teams, executive reports, customer satisfaction surveys, market segmentation analysis, product user statistics, demographic analysis, and business intelligence presentations.
-
Slide Structure
2-slide layout with dual donut charts (gold and brown) positioned left and right on each slide. Percentage values (70%, 35%, etc.) are centered within each chart. Label text areas below charts allow input of customer segment names.
Related Products
-

Percentage Visualization with Donut Charts
#Market and Competitor Analysis #Customer Success Stories #Graph
-

Customer Evaluation and Feedback on Renewable Energy Business - Doughnut Chart
#Market and Competitor Analysis #Customer Success Stories #Graph
-

Mountain Climbing Customer Evaluation and Feedback Donut Chart
#Market and Competitor Analysis #Customer Success Stories #Graph
-

Gender Comparison Analysis Pairwise Bar Graph – Understanding Customers' First Step
#Market and Competitor Analysis #Customer Success Stories #Graph
